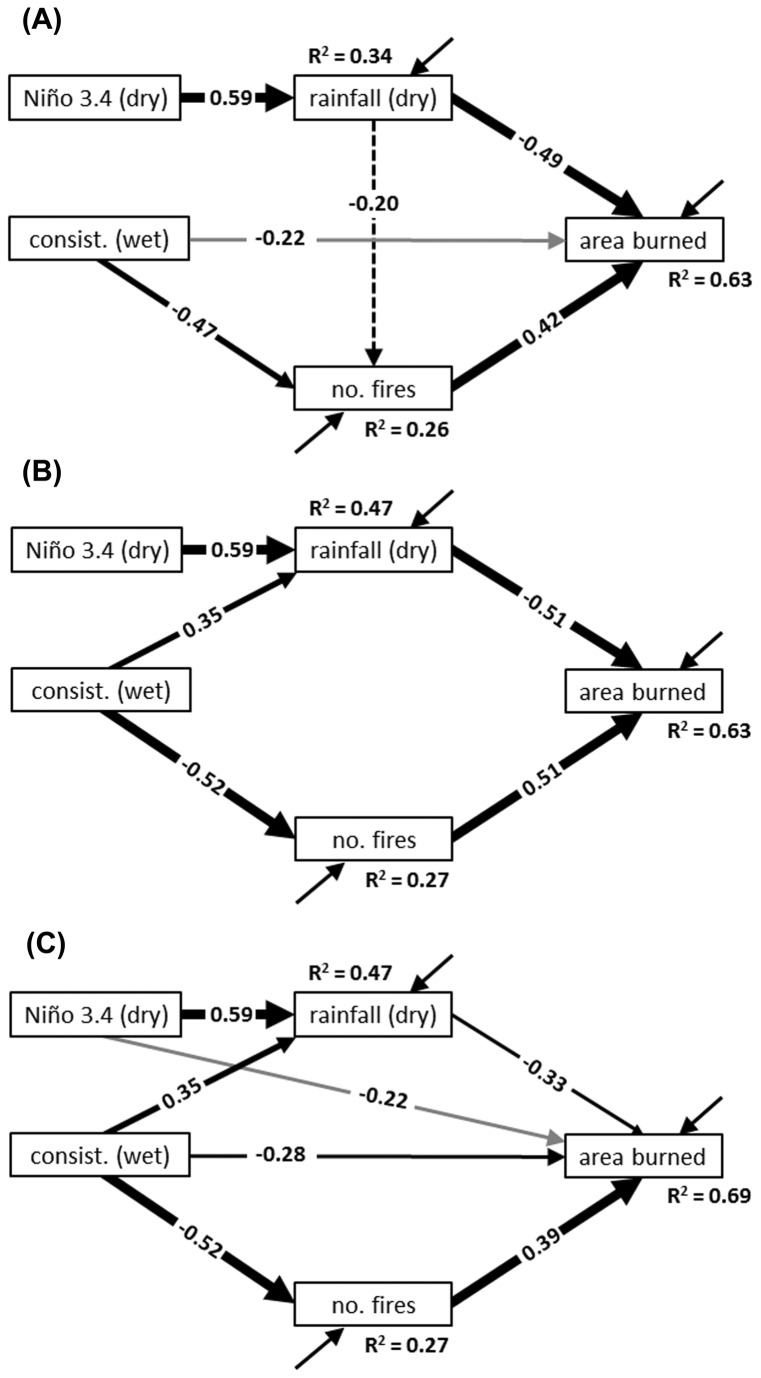
Figure 4. Structural equation models describing effects of selected climate variables on the wildfire regime.
The models include: (A) our starting, theory-based model (BCC = 37.0; χ2 = 9.3, df = 4, p = 0.05), (B) the second “best” exploratory model according to BCC values (BCC = 32.4; χ2 = 7.1, df = 5, p = 0.21), and (C) the “best” exploratory model (BCC = 32.3; χ2 = 2.0, df = 3, p = 0.57). Paths are labeled with numbers, which are standardized partial regression coefficients. The significance of these coefficients is shown with differently weighted lines (dashed = non-significant, gray = p ≤ 0.10, thin = p ≤ 0.05, moderate = p ≤ 0.01, and thick = p ≤ 0.001). Models are drawn using 30 years of climate and wildfire data from the Avon, Park Air Force Range, south-central Florida, USA (1978-2007).

