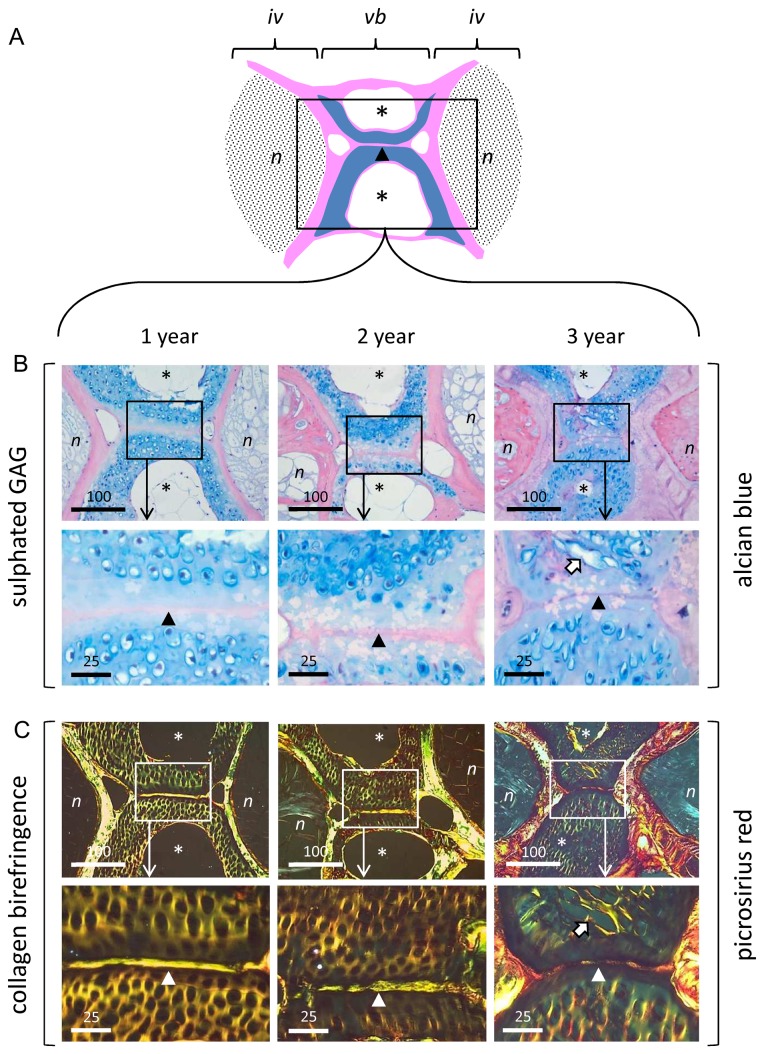
Figure 2. Aging zebrafish show changes in matrix organisation visible at the light microscopic level.
A. Schematic showing anatomical organisation of trunk vertebrae/intervertebral disc (mid-sagittal section plane). Vertebral bone depicted in pink; vertebral cartilage in blue; intervertebral discs shaded in black. B. Alcian blue staining of sulfated GAG in 1, 2, and 3 year spines. Upper panel: low power showing discs and interjacent vertebral body. Boxed areas denote regions examined at high power in underlying panel. Lower panel: Detail of Alcian blue staining within vertebral cartilage. Note prominent pericellular localisation of GAG and change in chondron morphology with age. C. Collagen birefringence (Picrosirius red staining under polarising optics) in 1, 2 and 3 year spines. Upper panel: low power showing discs and interjacent vertebral body. Boxed areas denote regions examined at high power in underlying panel. Lower panel: detail of collagen birefringence within vertebral cartilage. N.B. collagen birefringence occurs throughout the ECM at 1 and 2-years, but becomes increasingly organised within the pericellular matrix by 3-years. iv, intervertebral disc; vb, vertebral body; n, notochord-derived tissue; asterisks, cavities within cortical bone of vertebrae; arrow-head, notochordal tract running through cartilaginous inner facet of vertebral bodies; block arrow denotes coalescence of adjacent chondrons in 3 year samples. Scalebar in microns.

