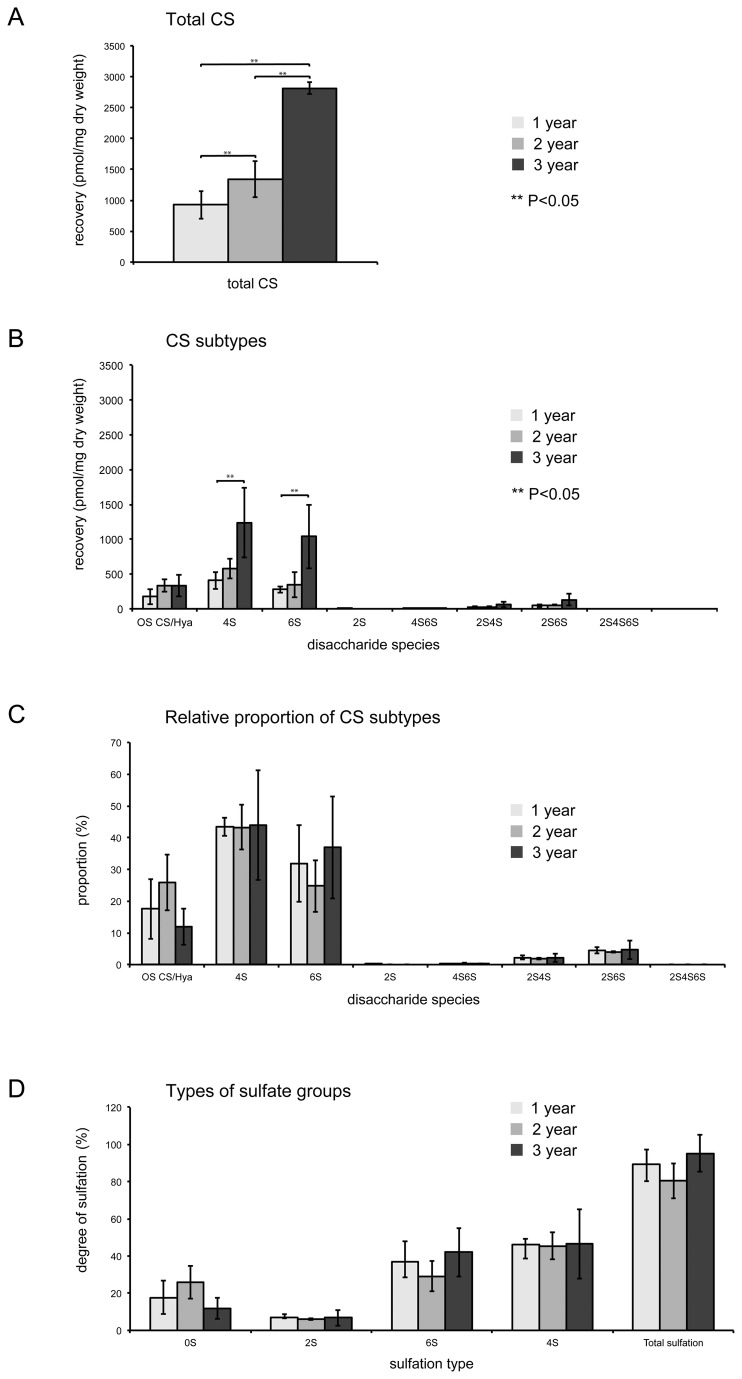
Figure 5. HPLC reveals increases to total vertebral chondroitin sulfate levels during aging.
A. Total quantities of CS disaccharides recovered per mg dry weight. Note the significant increase in total CS with age tested by One-way ANOVA; 2 vs 3 year P=1.18E-03, 1 vs 3 year P=1.76E-04 B. Amounts of the different CS subtypes recovered. P values: for 4S 1 vs 3 year P=0.0486, for 6S 1 vs 3 year P=0.0458 C. Relative proportions of the different disaccharide species, shows no significant change to ratios of different CS subtypes. D. Types of sulfation observed. There is no significant change to the amount of sulfation of the disaccharides over the three ages.

