
Figure 3. Aβ25–35 induces membrane perturbation in SH-SY5Y cells.
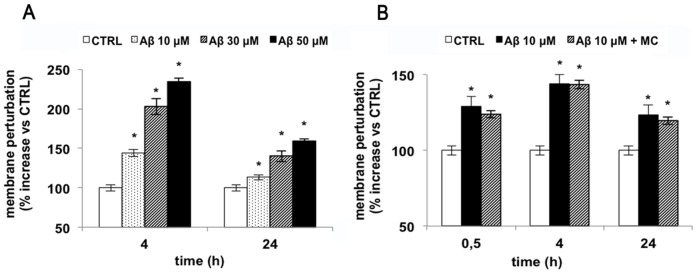
13000 cells were seeded in 96 well plates and treated with various amount of Aβ25–35 were incubated with 1 μM SYTOX™ Green in PBS. Changes in fluorescence were monitored (λex = 485 nm, λem = 520 nm) and plotted as the percentage of fluorescence relative to the control cells. A) Time-course of cells treated with 10 µM Aβ25–35 (white bar = control cells; black bar = Aβ25–35 treated cells; stripped bar = cells treated with Aβ25–35 in the presence of MC2050); B) Dose-dependent effect of Aβ25–35 on membrane perturbation (white bar = control cells; dotted bar = 10 µM Aβ25–35; stripped bar = 30 µM Aβ25–35; black bar = 50 µM Aβ25–35). Results are the mean of at least three independent experiments ± S.D. *p<0.05 vs. control cells.