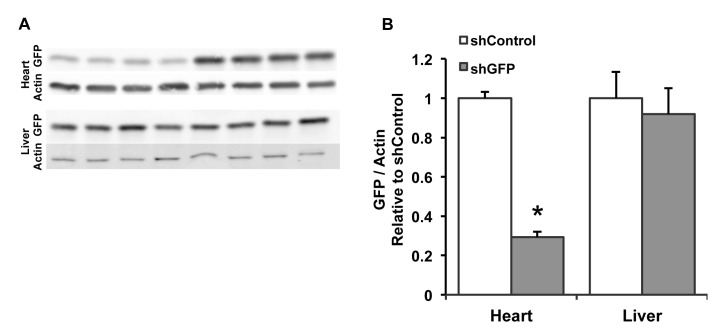
Figure 8. GFP protein in heart and liver.
(A) Western blots of GFP in heart and liver tissues, with actin used as a loading control. The first four bands in each sample are from the shGFP group, while the second four bands are from the shControl group. (B) Quantitative analysis of the Western blots shows that actin-normalized GFP expression was reduced by 71% in the shGFP-treated group compared to the shControl group in heart (n=4/group; p<0.0001), but there was no difference in GFP expression between groups in the liver.

