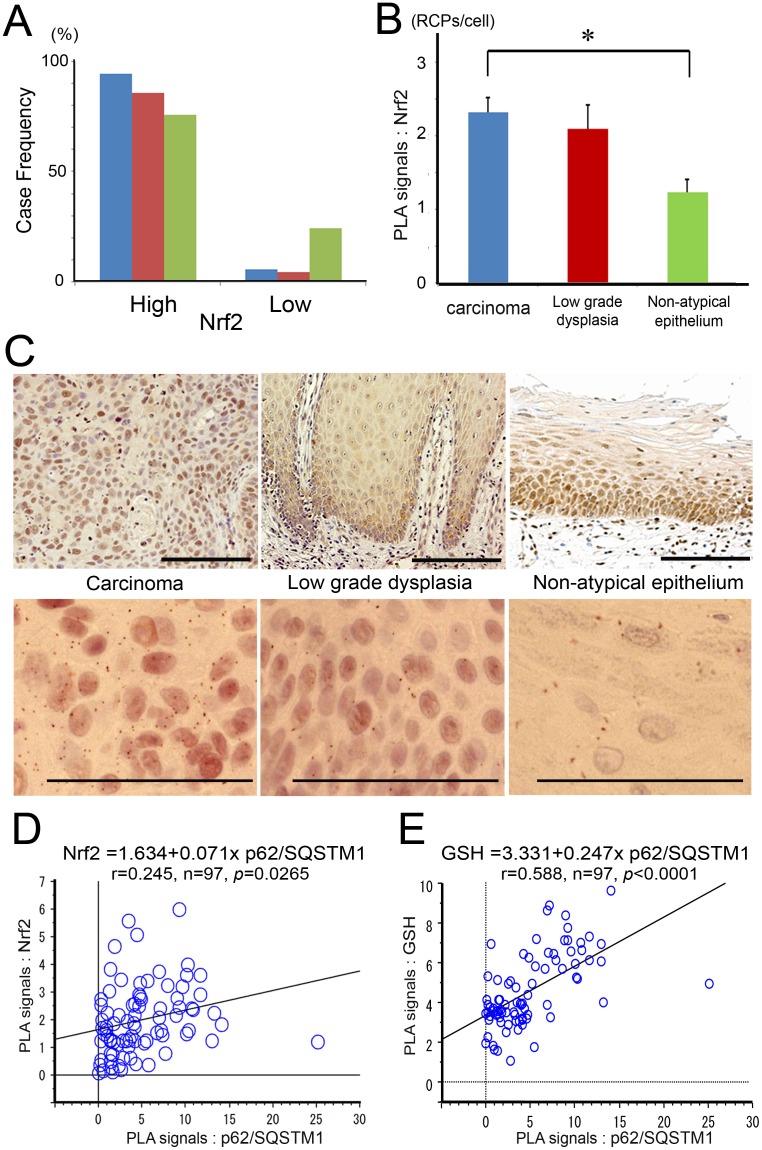
Figure 2. Nrf2 was abundantly expressed in carcinomas, low grade dysplasias, and non-atypical epithelia of oral tissue.
(A) Case-frequencies (%) of Nrf2 staining grades in oral squamous cell carcinomas (blue columns; 54 cases), low grade dysplasias (red columns; 14 cases) and non-atypical epithelia (green columns; 29 cases). (B) Means ± S.E. of PLA signals for Nrf2 are displayed as bar graphs. The values (RCPs/cell) are 2.32±0.20, 2.10±0.32 and 1.24±0.17 in carcinomas (54 cases), low grade dysplasias (14 cases) and non-atypical epithelia (29 cases), respectively. There was a significant difference between carcinomas and non-atypical epithelia (p = 0.0029), using one-way factorial ANOVA and multiple comparison tests accompanied by Scheffe's significance test. (C) Representative findings of Nrf2 staining in carcinoma (left), in low grade dysplasia (middle), and in non-atypical epithelium (right). Corresponding PLA signals are displayed in the lower row. Scale bar; 100 µm. (D) There was a weakly positive correlation between p62/SQSTM1- and Nrf2- PLA signals (Pearson’s correlation coefficient; r = 0.245, n = 97, p = 0.0265). (E) There was a strongly positive correlation between p62/SQSTM1- and GSH-PLA signals (Pearson’s correlation coefficient; r = 0.588, n = 97, p<0.0001).

