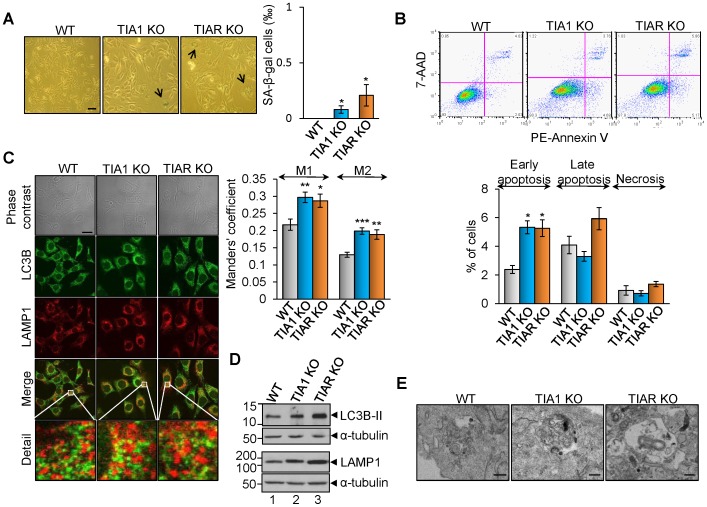
Figure 7. TIA1 and TIAR KO MEFs show high rates of autophagy.
(A) Senescence analysis with SA-β-gal staining. Wild-type (WT), TIA1 KO1 and TIAR KO MEF cells were subjected to SA-β-gal staining and quantified of positively stained cells. The represented values are means + SEM (n = 12 fields; *P<0.05). Scale bars represent 40 µm. (B) Analysis of cell death rates. Rates of apoptosis (early and late) and necrosis were quantified by using 7-AAD staining and PE Annexin V apoptosis detection kit followed by flow cytometry analysis. The graph shows the percentage of cells counted that were in each stage of cell death. The represented values are means + SEM (n = 9; *P<0.001). (C) Visualization of autophagosomes and lysosomes in wild-type (WT), TIA1 KO and TIAR KO MEFs cells by indirect immunofluorescence using anti-LC3B and anti-LAMP1 antibodies. The extended detail illustrates the degree of cellular co-localization between both markers as evidence of autolysosomes. The overlapping degree between signals was quantified using Manders' M1 and M2 colocalization coefficients. We can therefore interpret, in these simple cases, the M coefficients as the percentage of pixels in one channel that intersect with some signal in other channel. The represented values are means + SEM (n = 8 fields; *P<0.05; **P<0.01; ***P<0.001). Scale bars represent 20 µm. (D) Analysis of molecular markers for autophagy and lysosomes. Western blot analysis of wild-type (WT), TIA1 KO and TIAR KO MEFs cell extracts using 2 µl from 1×10⁷ cells/ml to quantify the expression levels of LC3B and LAMP1 proteins, respectively. The blot was probed with antibodies against LC3B, LAMP1 and α-tubulin proteins, as indicated. Molecular weight markers and the identities of protein bands are shown. (E) Autophagic flux analysis. Obvious double-membraned autophagosome and vacuoles with engulfed bulk cytoplasm and cytoplasmic organelles (mitophagy) are shown. Please, see also Fig. S7 and S8. Scale bars represent 250 nm.

