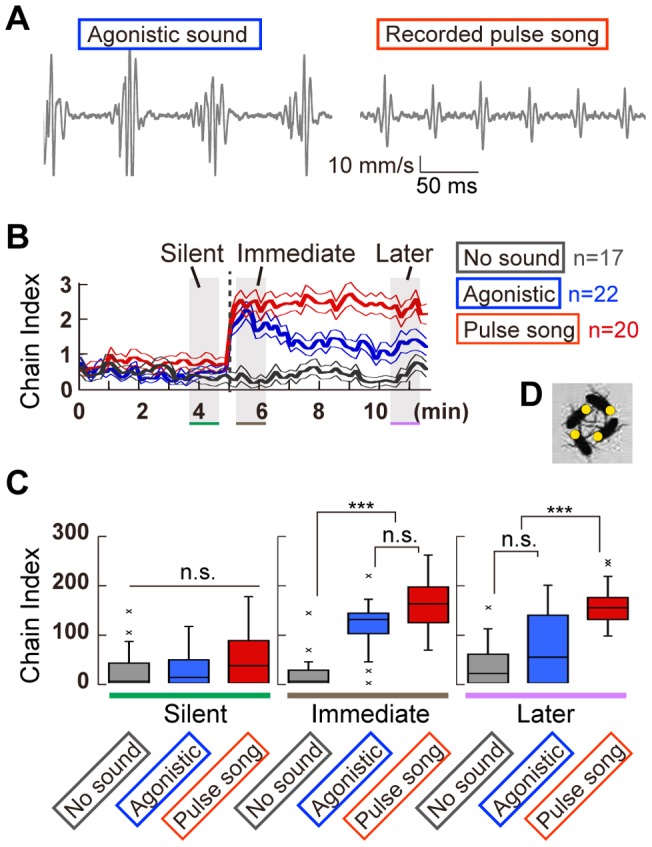
Figure 4. Recorded fly sounds evoke chain formation.

(A) Recorded sounds used in this assay. (B) Time-course for the chain index. Responses to an agonistic sound and a pulse song are color-coded in blue and red, respectively. Response without sound (no sound) is shown in gray. (C) The cumulative chain indices during three temporal phases of 1-min, shown in Fig. 4B (Kruskal-Wallis test followed by Scheffe's multiple comparison, ***p<0.005; n. s., not significant). (D) Flies under the agonistic sound. Yellow circles indicate the positions of the fly head.
