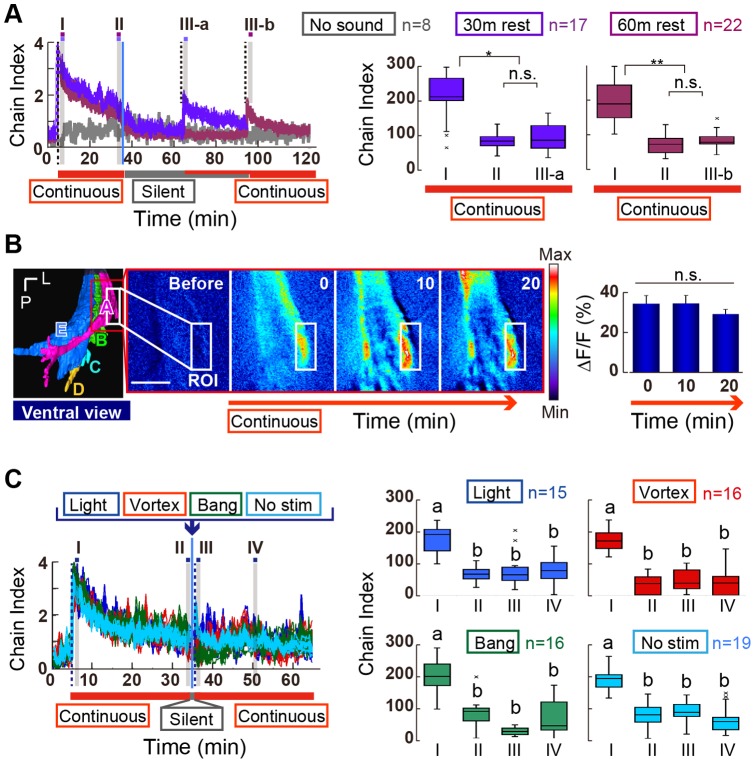
Figure 5. Decrease in the chaining behavior.
(A) Retrieval test. Flies exposed to the continuous pulse song for 30 min were maintained in silence for 30 min (bluish-purple) or 60 min (red-purple), and returned to sound-exposure. Dotted vertical lines indicate the start and restart of the sound playback (Left panel). Blue vertical line indicates cessation of the first playback. The chain index for the initial phase (I) was significantly higher than those in later (II) and after the restart (III-a and III-b) temporal phases (Middle and Right panels). (B) GCaMP3 fluorescent change to the continuous pulse song. Left panel shows a ventral view of the AMMC. The AMMC is the primary center for JO neurons and is anatomically subdivided into zones A (magenta), B (light green), C (light blue), D (orange), and E (blue). Pseudocolor images at 0, 10, and 20 min after stimulus onset are shown (middle panels). The region of interest (ROI) was set in the AMMC zone A. 1-min averages of the ΔF/F intensity at 0, 10, and 20 min after stimulus onset was plotted (right panel). No significant difference was observed between them (N = 4, Friedman's test followed by Scheffe's multiple comparison). P, posterior; L, lateral. Scale bar = 20 µm. (C) Dishabituation tests. Light blink (blue), vortex (red), bang (green), or a short silent period (light blue) does not restore the behavioral suppression to the continuous pulse song (Left panel). A dishabituation stimulus was applied at the start of a 40-s silent interval (arrow). Dotted vertical lines indicate when the sound playback was started (at 5 min) and restarted (at 35 min 40 s). A blue vertical line indicates cessation of the first playback. Right panels show the cumulative chain indices for four temporal phases. **p<0.01; *p<0.05; n. s., not significant.

