
Fig. 2.
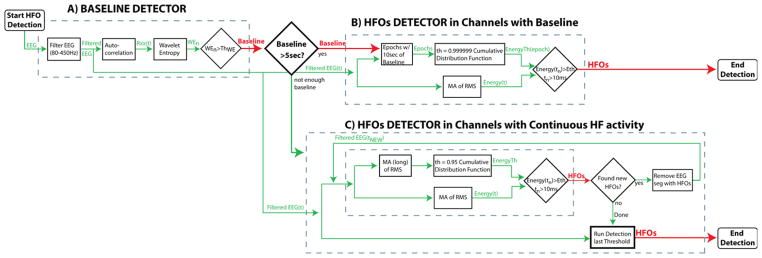
Diagram of the MNI detector. (A) baseline detector. (B) HFOs detection in channels with baseline. (C) HFOs detection in channels with continuous high frequency activity. If more than 5 s/min of baselines are found, HFOs are detected with respect to the baseline segments (B). If less than 5 s/min of baseline were detected, HFOs are detected with respect to the entire EEG segment in an iterative way (C). WE: wavelet entropy; Rxx: autocorrelation; th: Threshold.