
Fig. 5.
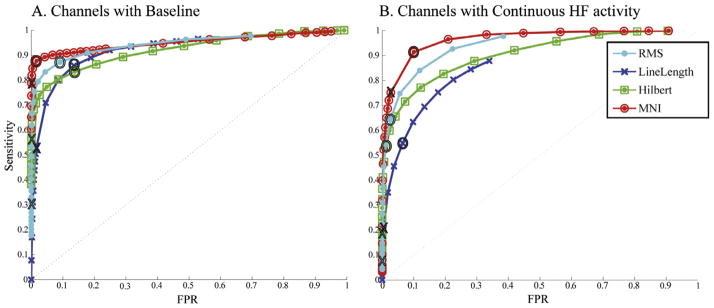
ROC curves pooling events together for the same 80–450 Hz FIR filter. When pooling all the events together the difference in performance among detectors become more striking than when averaging across channels. Channels where baseline can or cannot be found are separately shown. X: original thresholds; O: optimum threshold (closest to left top corner in ROC average across channels). Thresholds are the same as in Fig. 4.