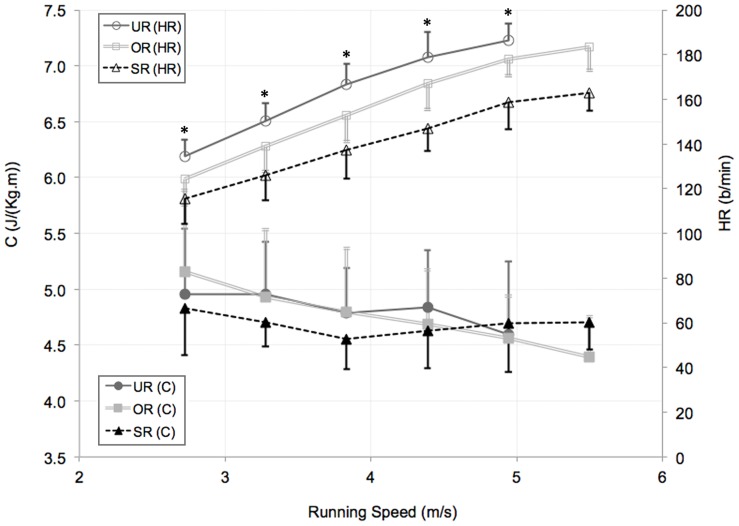
Figure 5. Mean values ± SD for the cost of transport (C) (lower curves) and for the heart rate (HR) (upper curves).
C and HR are plotted against running speed for untrained runners (UR), occasional runners (OR) and skilled runners (SR). Results obtained with the two-way ANOVA (group×running speed) show no significant difference among groups of subjects across velocity for C, which results to be independent of the running speed. HR increased significantly with the running speed for all the three group of subjects. Furthermore we obtained significantly higher HR values for UR compared to OR and SR (* = p<0.01).

