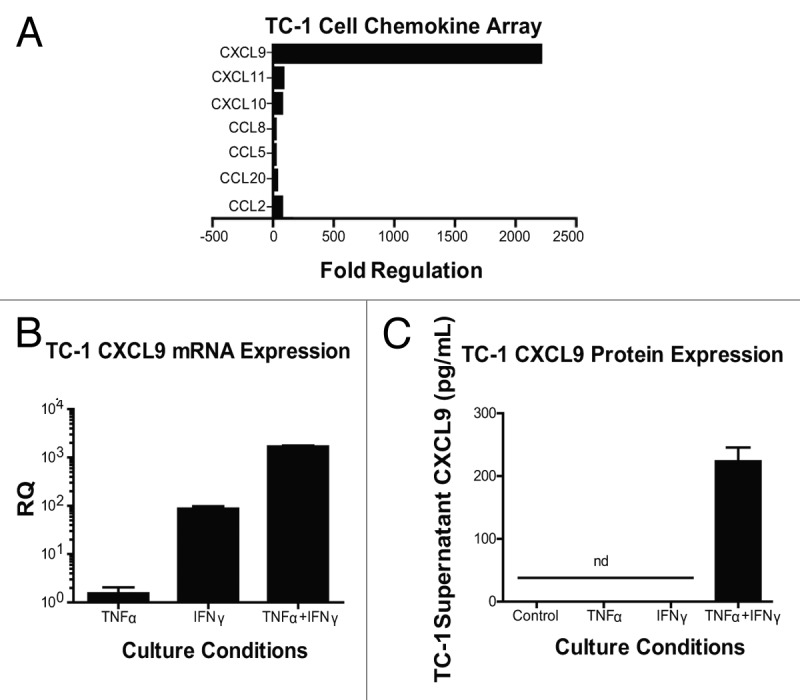
Figure 4. Interferon γ induces the expression of chemokines by - cells. (A–C) Samples from TC-1 cells that were maintained under control conditions or cultured with tumor necrosis factor α (TNFα) and interferon γ (IFNγ), were collected and then processed for chemokine PCR arrays (A), CXCL9-specific quantitative RT-PCR assays (B) or CXCL9-specific ELISAs (C). In (A and B) data are reported as fold changes in mRNA expression relative to cells maintained in control conditions. Mean RQ or protein concentration values ± SEM (of 2 independent experiments) are reported in (B and C) respectively. nd, not detected.
