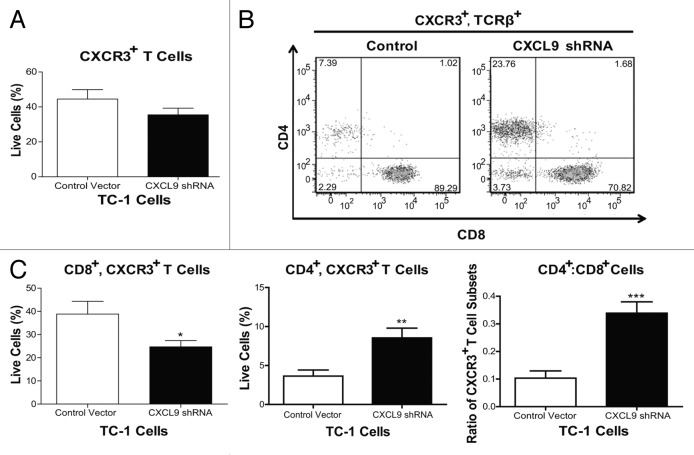
Figure 5. Knockdown of CXCL9 in TC-1 cells alters T-cell subset distribution in the tumor plugs of vaccinated mice. (A–C) TC-1 cells bearing a control plasmid or a shRNA plasmid for the downregulation of CXCL9 were co-injected with basement membrane extract (BME) and allowed to form plugs for 7 d. On day 7, mice were vaccinated with Lm-LLO-E7 bacteria and, 7 d later, tumor plugs were removed and processed for the cytofluorometric measurement of the percentages of CXCR3+TCRβ+ as well as CD8+CXCR3+TCRβ+ and CD4+CXCR3+TCRβ+ T lymphocytes (among live single cells). The percentage of CXCR3+TCRβ+ cells is reported in panel (A) whereas representative density plots of the relative abundance of CD8+CXCR3+TCRβ+ and CD4+CXCR3+TCRβ+ T lymphocytes is depicted in (B) In (C) quantitative data on the percentages of CD8+CXCR3+TCRβ+ and CD4+CXCR3+TCRβ+ T cells as well as on their ratio are reported. In (A and C) columns represent mean values ± SEM of pooled data (n = 7) from two independent experiments (2–5 mice per group) (*P ≤ 0.05, **P ≤ 0.01, ***P < 0.001).

An official website of the United States government
Here's how you know
Official websites use .gov
A
.gov website belongs to an official
government organization in the United States.
Secure .gov websites use HTTPS
A lock (
) or https:// means you've safely
connected to the .gov website. Share sensitive
information only on official, secure websites.
