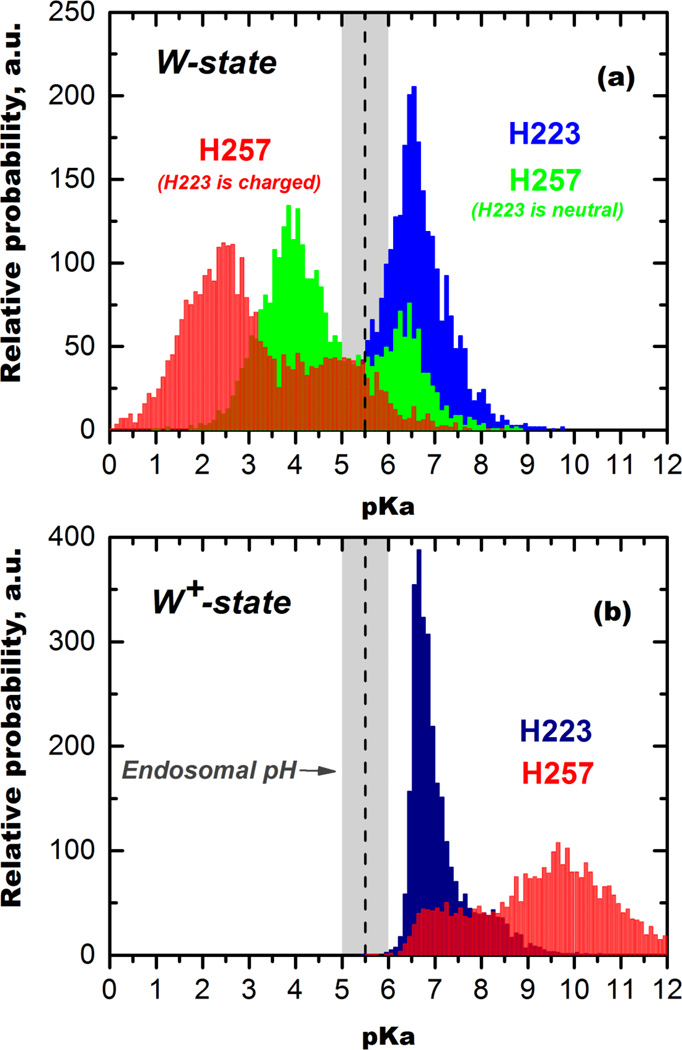
Figure 6.
pKa distributions of key histidine residues, H223 and H257, calculated in PB approximation from MD traces for (A) membrane-incompetent W-state and (B) membrane-competent W+-state (region of 4.0–6.7 µsec in protonated MD run from Fig. 5 B, D) (see text for details).

