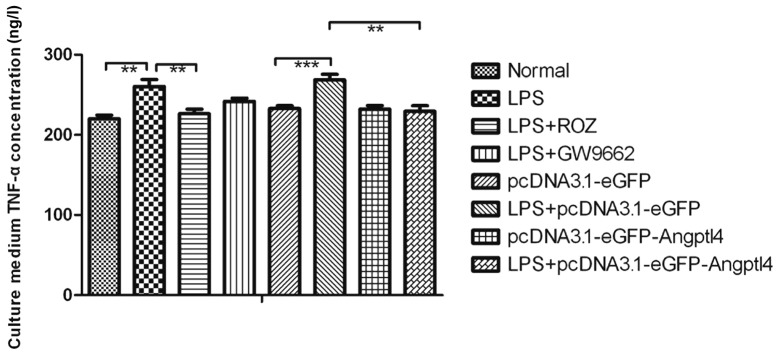
Figure 4.

TNF-α concentration in the cell culture medium was examined by ELISA. Data are presented as the means ± SD. **P<0.05, normal vs. lipopolysaccharide (LPS) group. ***P<0.01, ROZ vs. LPS + pcDNA3.1-eGFP group. ***P<0.01, LPS + pcDNA3.1-eGFP group vs. the pcDNA3.1-eGFP-Angptl4 group.
