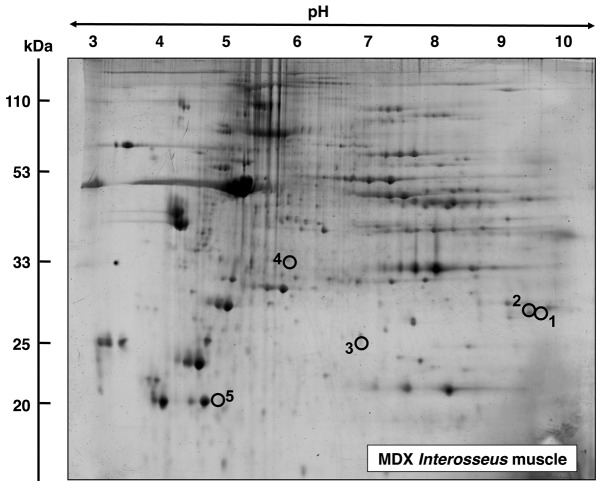
Figure 7.
Fluorescence two-dimensional (2D) gel electrophoretic analysis of interosseus muscle from mdx mice. Shown is a representative RuBPs-labelled master gel of crude tissue extracts from dystrophic interosseus muscle. Protein spots with an age-related change in expression levels are marked by circles and are numbered 1–5. See Table IV for the mass spectrometric identification of individual muscle-associated proteins. The pH-values of the first dimension gel system and molecular mass standards of the second dimension are indicated on the top and on the left of the panels, respectively.

