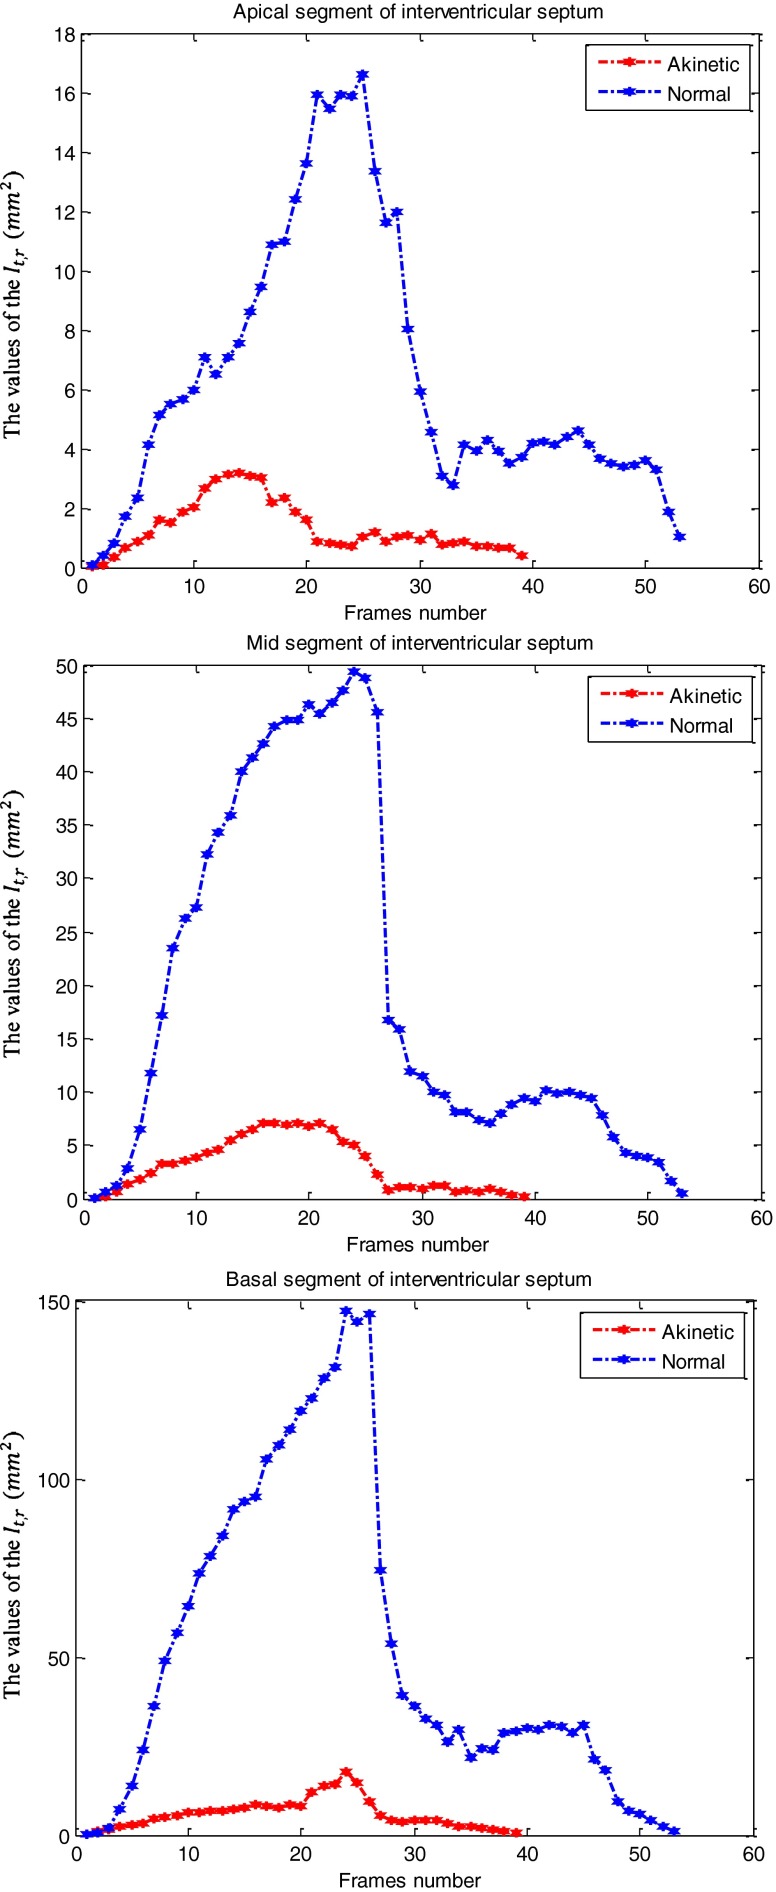
Fig. 5.
The curve obtained from the values of the It,r (Eq. 8) for the images of one cardiac cycle in the apical (up), mid- (middle) and basal (bottom) segments of interventricular septum (left wall of LV in A4C view) for a healthy case and a patient case. It should be noted that the images of one cardiac cycle for the healthy and the patient cases are 40 and 54, respectively. The maximal value of each curve is defined the proposed quantitative index for this region Indr

