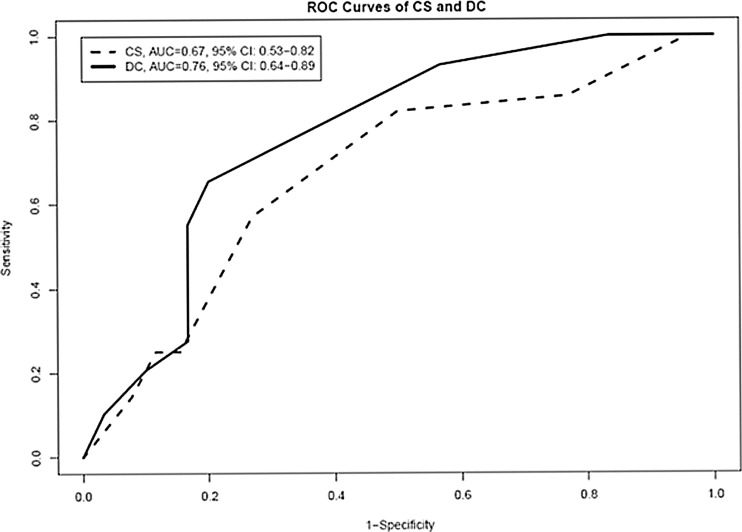
Fig. 1.
ROC curves of the mean scores for the CADstream and the DynaCAD for Breast systems. The figure shows the ROC curves based on the two mean diagnostic scores of the three raters for each software system. CS CADstream, DC DynaCAD for Breast, AUC area under the curve, ROC receiver operating characteristic

