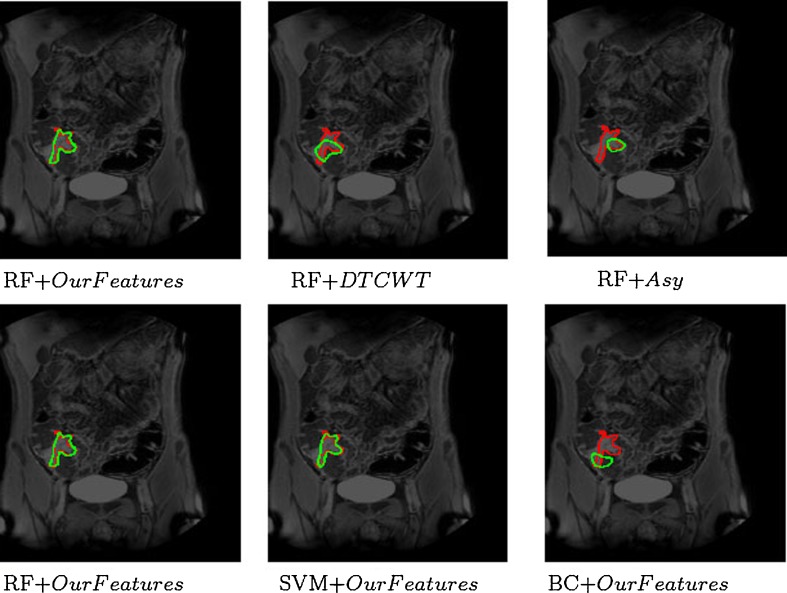
Fig. 5.
Visual results for CD detection in Patient 23. First row shows results of RF using different features (our features, DTCWT, and Asy). Second row shows performance of different classifiers (RF, SVM, and BC) using our features. The two images in the first column are identical and are shown for continuity

