Figure 1.
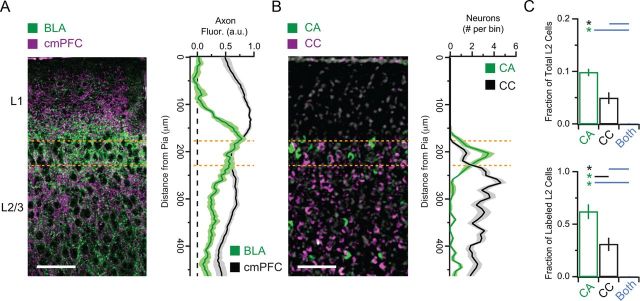
Anatomical basis of reciprocal circuits in the mPFC. A, Left, Anterogradely labeled axons from the BLA (green) and cmPFC (magenta) in the mPFC. Scale bar, 100 μm. Right, Normalized BLA (green) and cmPFC (black) axon fluorescence as a function of distance from the pial surface. Orange dotted lines show the approximate region of L2 considered in this study. B, Left, Retrogradely labeled CA (green) and CC (magenta) L2 pyramidal neurons in the mPFC. Gray shows DAPI-positive nuclei. Scale bar, 100 μm. Right, Median number of CA (green) and CC (black) neurons as a function of distance from the pial surface. C, Summary of the number of CA neurons, CC neurons, and dual-projecting neurons as a fraction of total cells in L2 (top) or labeled cells in L2 (bottom). Asterisks indicate significant comparisons. Color of asterisks and lines indicate which groups are compared.

