
Figure 3.
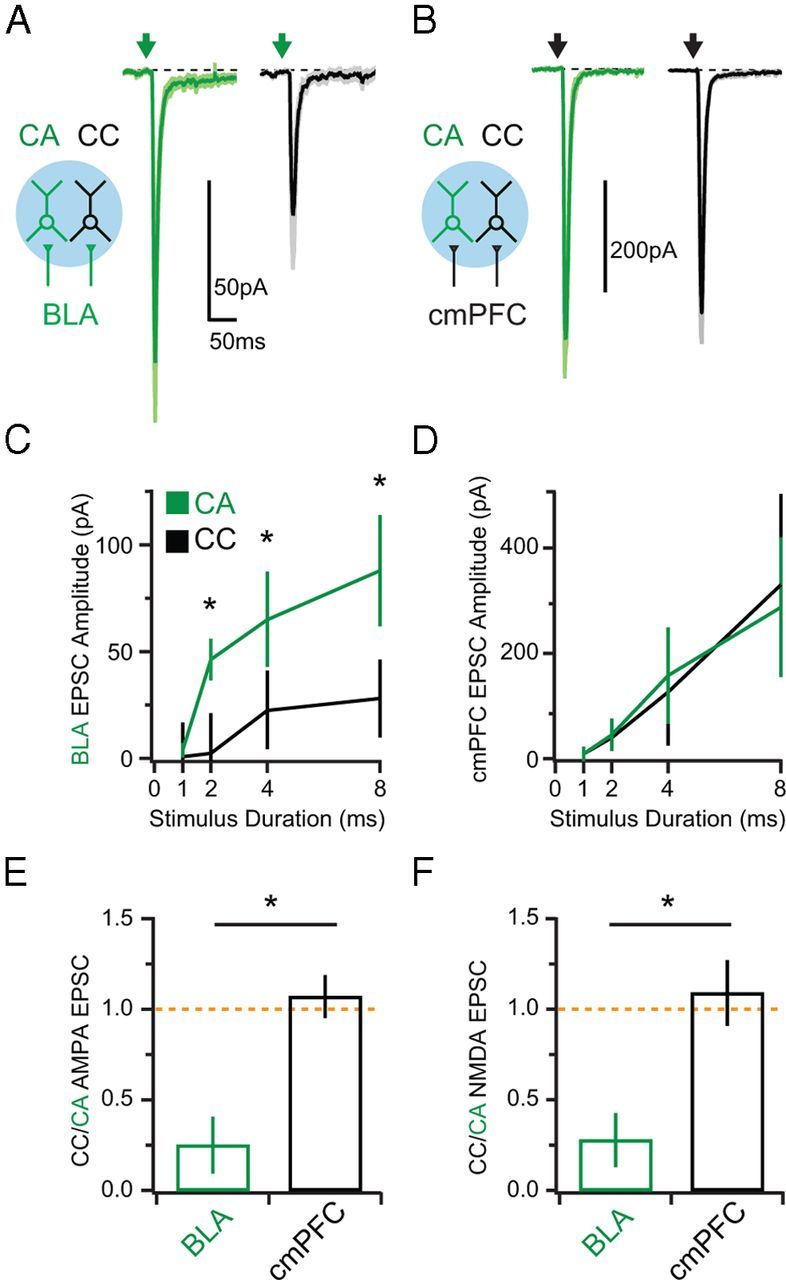
Synaptic strength of BLA and cmPFC inputs. A, Left, Schematic showing activation of BLA inputs (green) onto CA (green) and CC (black) neurons via wide-field illumination (blue). Right, AMPAR EPSCs evoked by BLA inputs at sequentially recorded CA and CC neurons. Arrows denote LED stimulation. B, Same as A but for cmPFC inputs. C, Summary of AMPAR EPSC amplitudes as a function of pulse duration for BLA inputs. D, Same as in C but for cmPFC inputs. E, Ratio of AMPAR EPSCs at CC and CA neurons evoked by BLA (green) or cmPFC (black) inputs. F, Same as in E but for NMDAR EPSCs. Asterisks indicate significance. Orange dotted line indicates a CC/CA ratio of unity.