Figure 2.

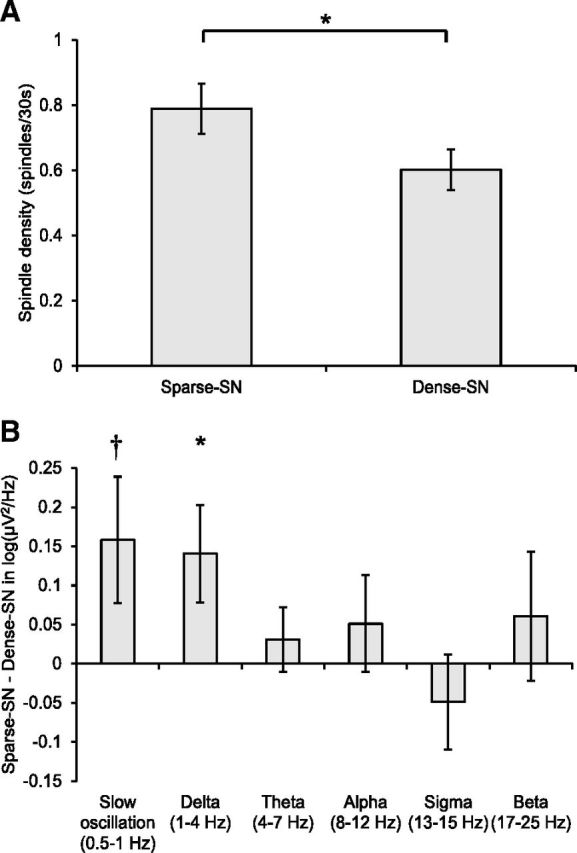
A, Spindle (11–15 Hz) density averaged across left hemisphere electrodes. B, Difference in spectral power between neighborhood conditions averaged across left hemisphere electrodes. Error bars indicate SEM. *p < 0.05; †p < 0.10.

A, Spindle (11–15 Hz) density averaged across left hemisphere electrodes. B, Difference in spectral power between neighborhood conditions averaged across left hemisphere electrodes. Error bars indicate SEM. *p < 0.05; †p < 0.10.