
Figure 7.
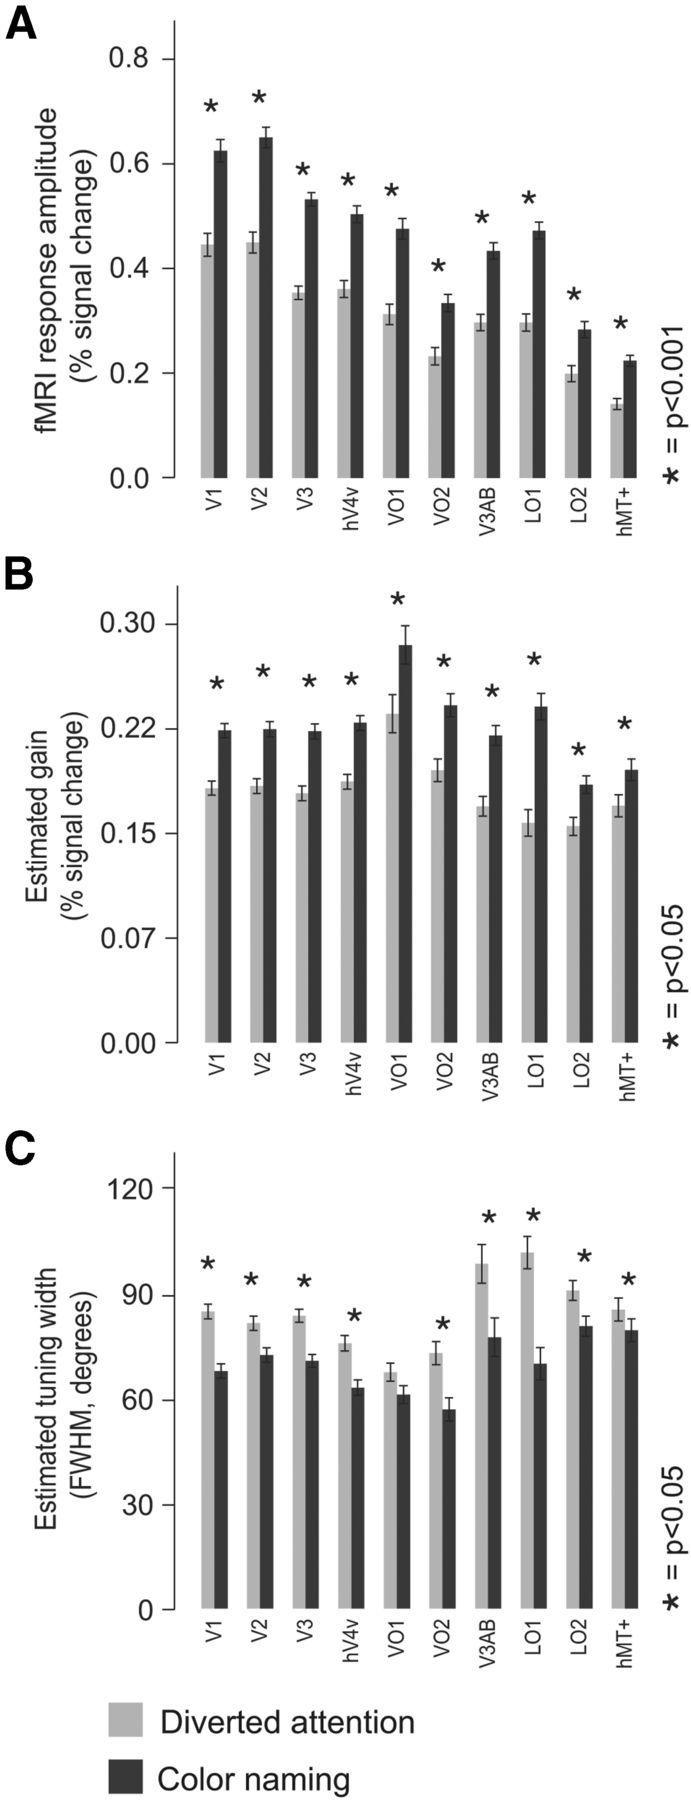
Response amplitudes, gain, and voxel tuning width. A, Response amplitudes, averaged across all voxels within each visual area, for each of the two task conditions. Light gray bars, Diverted attention task; dark gray bars, color-naming task. Error bars indicate SDs across subjects and scanning sessions. Asterisks indicate visual areas for which the responses were significantly greater during the color-naming task compared to the diverted attention task. B, Estimated gain in each visual, for each task. Error bars indicate SDs across subjects and scanning sessions. C, Estimated average tuning width (full-width at half maximum, in degrees) for each visual area and for each task. Error bars indicate SDs across subjects and scanning sessions.