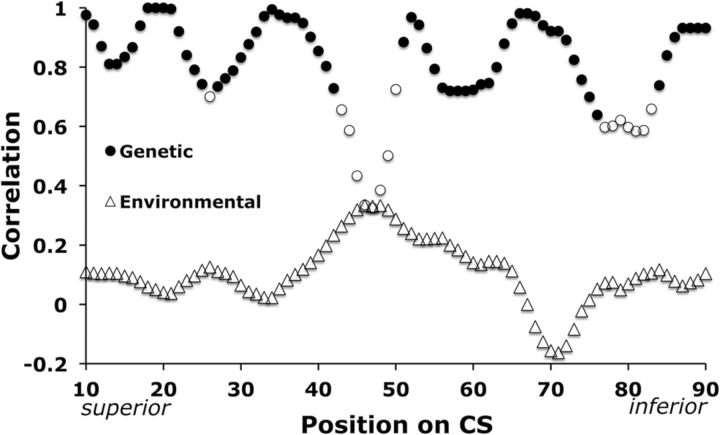
Figure 4.
Correlation of left and right DPP analogs. Common genetic and environmental influence of left and right analogous CS depth measurements. Correlation coefficients are plotted as a function of position on the profile. Shaded circles were significant, indicating pleiotropy (ρG,avg = 0.88, pavg = 0.009, FDR = 0.05). No environmental correlation coefficients reached significance (ρE,avg = 0.10, pavg = 0.17; ▵).

