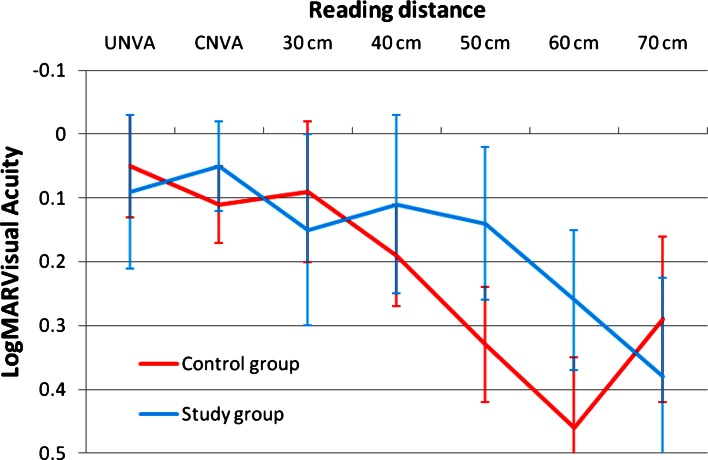
Fig. 4.
Difference in near acuity at different distances with or without correction. There is no clinical or statistical difference for the 30 and 40 cm distance between the study and control groups. However, there is a clinical and statistically significant better reading at 50 and 60 cm for the study group (p < 0.03 at 50 cm and p < 0.007 at 60 cm)

