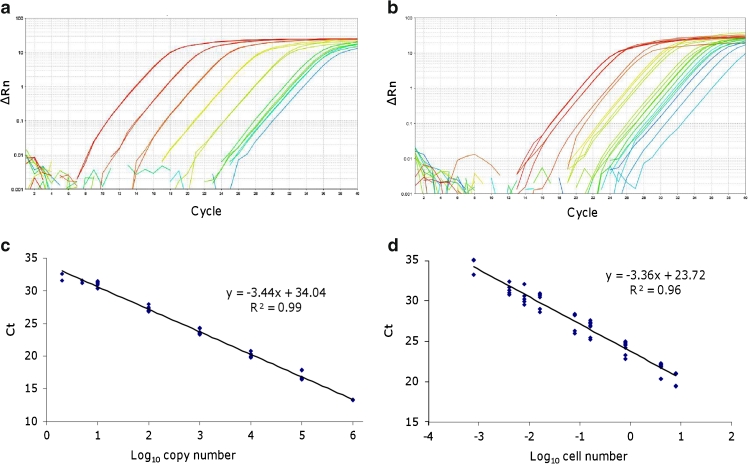
Fig. 1.
Examples of amplification plots generated from dilutions of a target sequence (LSU rDNA from Ostreopsis cf. ovata) cloned into a plasmid (a) and from O. cf. ovata cell dilutions (b). The corresponding standard curves (c, d) were obtained by the correlation of C t values and log10 input plasmid copies or environmental cell number, respectively. Adapted from Perini et al. (2011)

