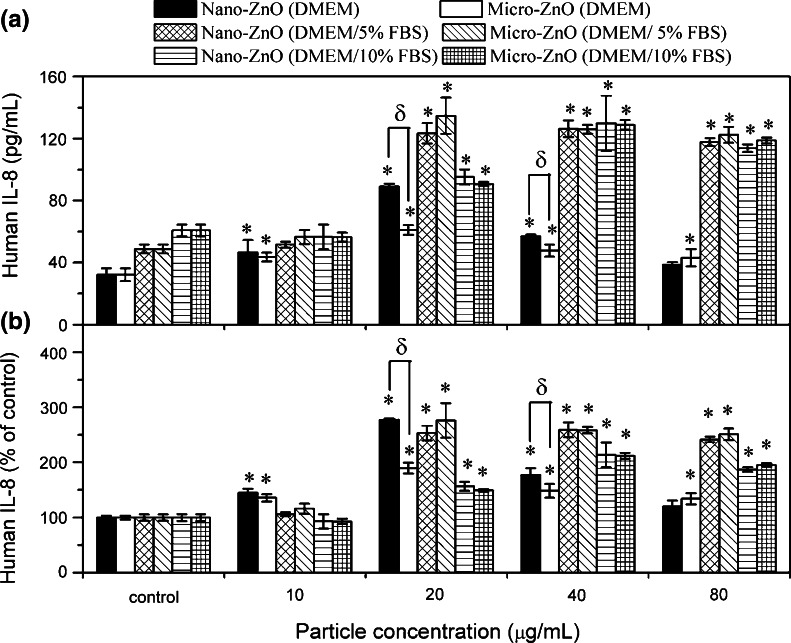
Fig. 8.
IL-8 production from A549 cells after 24 h exposure to nano- and micro-ZnO in DMEM with various percentages of FBS. a y-axis is expressed as production of IL-8 (pg/mL). b y-axis is expressed as IL-8 releasing folder (% of control). *p < 0.05 compared to untreated controls; δ p < 0.05 compared between treated groups. Two-way ANOVA analysis revealed significant contrasts related to serum factor for all dosages, upon adjustment of particle size, p < 0.01

