
Figure 2.
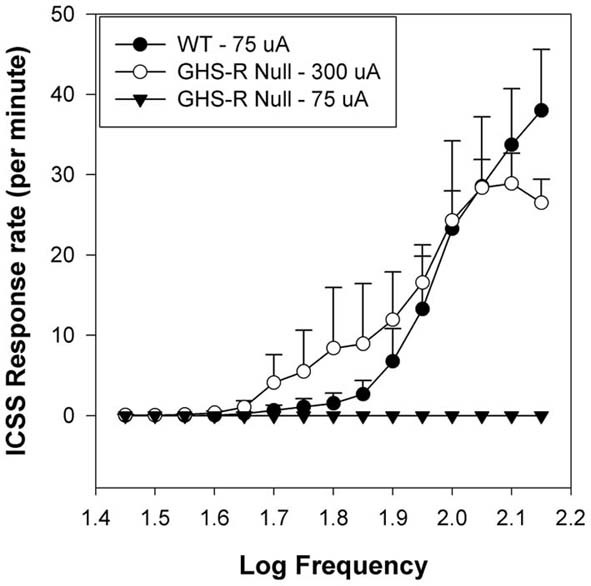
Mean group Intracranial Self-Stimulation (ICSS) rate-frequency scores for wild-type (WT: n = 5) and GHR-R null rats (n = 6) as a function of stimulation intensity. WT rats tested at 75 uA and GHR-R null rats tested at 300 uA exhibit overlapping rate-frequency curves. When GHR-R null rats were tested at 75 uA, their rate-frequency curves dropped to 0. Figure reprinted with permission from Addiction Biology (Wellman et al., 2012).