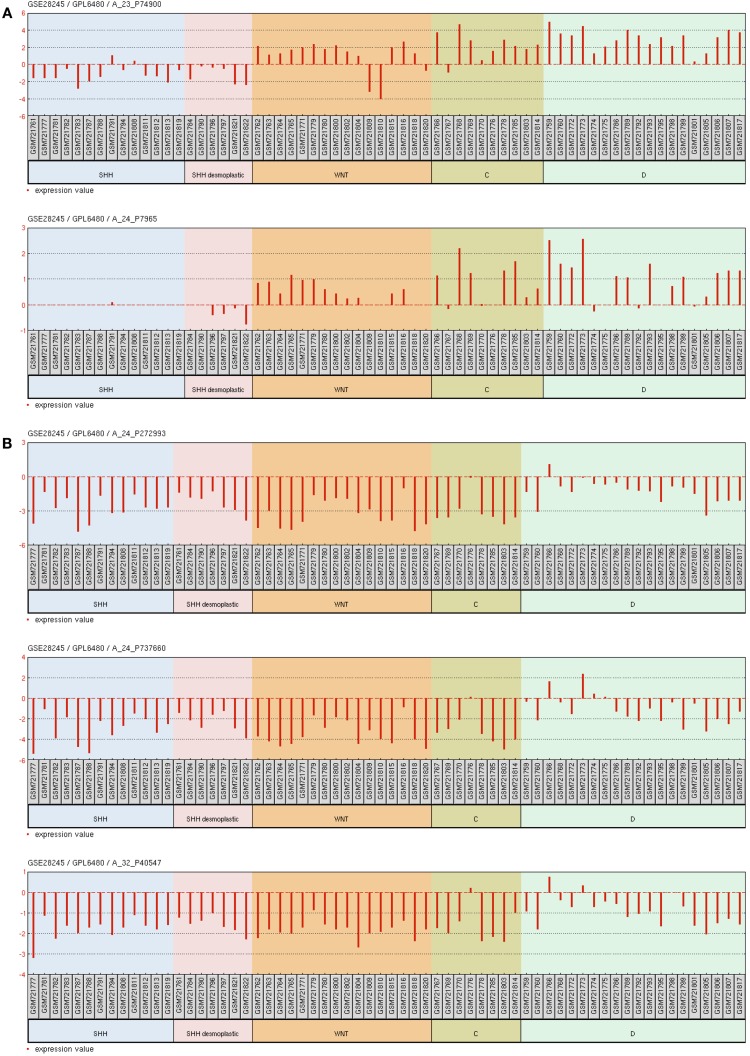
Figure A4.
Gene expression graph for different microarray probes of interest. Data from 64 primary human MB samples accessible through GEO Series accession number GSE28245 (38) in NCBI’s Gene Expression Omnibus. (A) probe sets for ESRRG. (B) Probe sets for MEG3. Samples were grouped according to the molecular MB subgroups into WNT, SHH, C, and D. SHH desmoplastic was separated from SHH classic.

