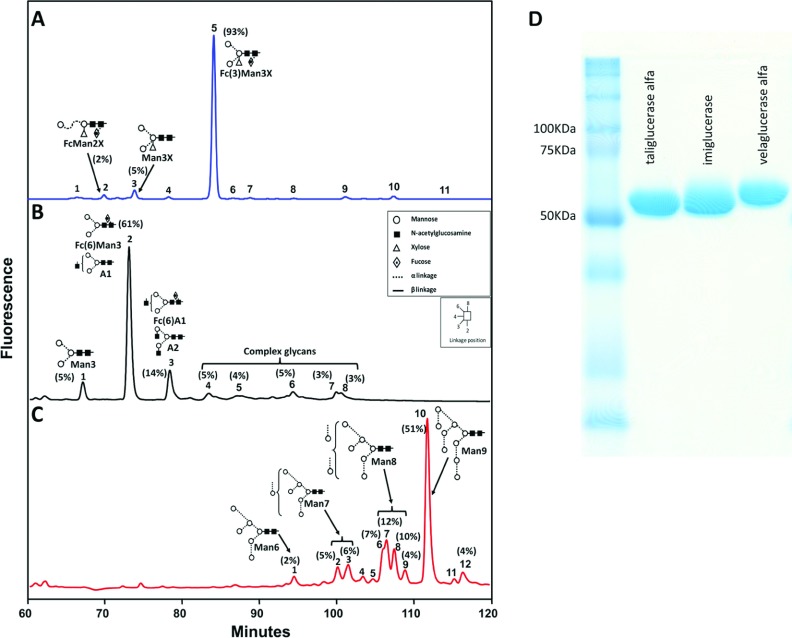
Figure 1. Comparison of the glycosylation profile of velaglucerase alfa, taliglucerase alfa and imiglucerase.
Representative NP-HPLC separation of glycans released by endoglycosidase digestion followed by fluorescent labelling, using 2AB. The relative area of the various glycans (above 2%) is indicated in parentheses, adjacent to the peak numbers. Main peaks in profiles are annotated with glycan structures and acronyms: Ax=(GlcNAcx)Man3-GlcNAc2; Fc=core fucose; Fc(3)=α1-3 linked fucose; Fc(6)=α1-6 linked Fucose; Man=mannose; Manx=Manx-GlcNAc2; X=xylose. (A) taliglucerase alfa shows a main peak of a paucimannose glycan Fc(3)Man3X; (B) imiglucerase shows a main peak of a mixture of Fc(6)Man3 and a mono-antennary (A1) structure, with further various complex glycans; and (C) velaglucerase alfa shows mainly variations of high mannose structure glycans (Man3-Man9); (D) SDS/PAGE separation of the various enzymes can be found to the left of the HPLC runs. Differences in retention time of bands on the gel correlate to the difference in molecular mass and glycosylation of the various enzymes. Further information can be found in Supplementary Table S1.

