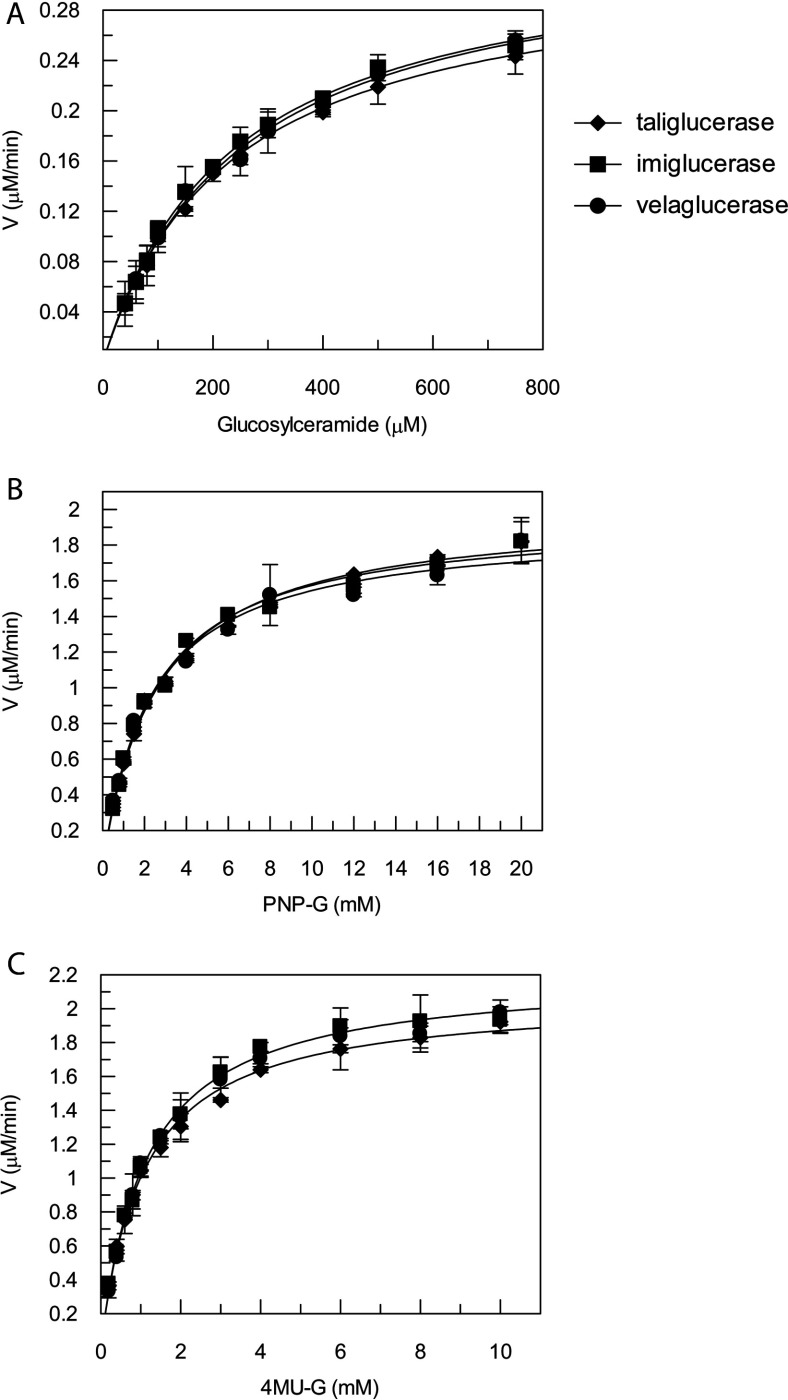
Figure 2. Michaelis–Menten curve.
Kinetic activity assay plots of velocity compared with concentration of all three β-glucocerebrosidase enzymes using (A) glucosylceramide and (B) PNP-G and (C) 4MU-G as substrates. Kinetic parameters of Km and Vmax are summarized in Table 2. Results are an average of three independent experiments ±S.D.

