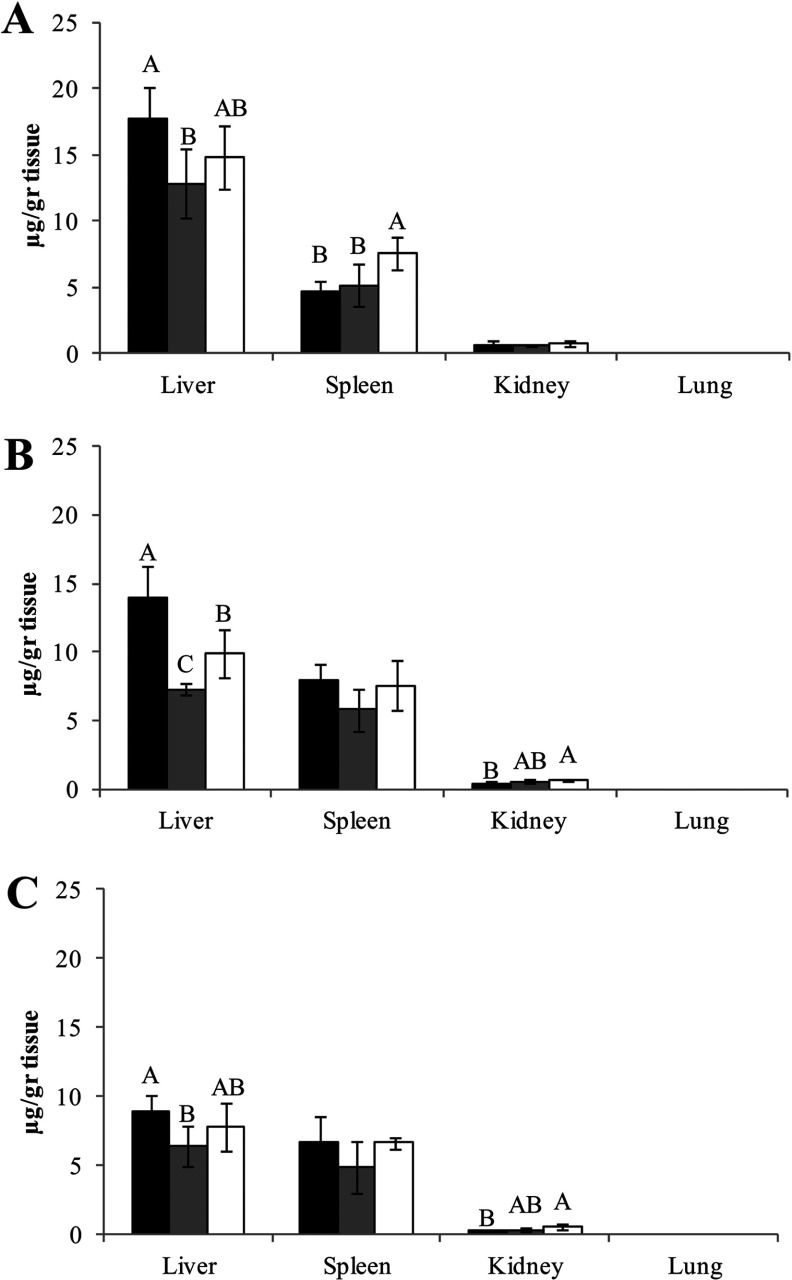
Figure 6. Uptake of β-glucocerebrosidase into mice organs.
Biodistribution to liver, spleen, kidney and lung of mice evaluated by activity measurement after: (A) 20; (B) 40; and (C) 60 min post-injection. ICR mice were intravenously administrated with three β-glucocerebrosidase commercial enzymes (1.8 mg/kg, similar to clinical dose in humans); taliglucerase alfa, dark bars (■); imiglucerase, grey bars (■); and velaglucerase alfa, clear bars (□). Each error bar represents the S.D. about the mean. Bars marked with the same or no letter (i.e., A, B, C) indicate that differences between results are insignificant, using analysis of one-way ANOVA Tukey–Kramer HSD. Different letters symbolize significant difference (P<0.05).

