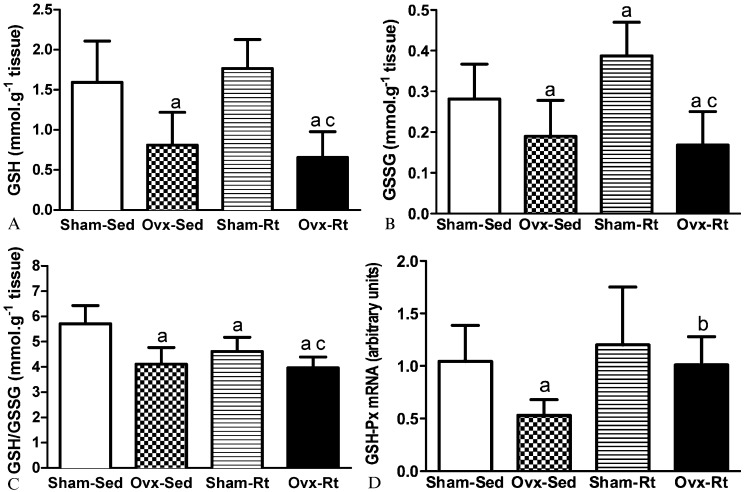
Figure 2a - Levels of GSH (a) in liver homogenates 48h after the last session of the resistance training program in sham-operated sedentary (Sham-Sed), ovariectomized sedentary (Ovx-Sed), sham-operated resistance training, (Sham-Rt) and ovariectomized resistance training (Ovx-Rt). Values are presented as mean ± SDM; p ≤ 0.05. a statistically significant difference compared to Sham-Sed, c compared to Sham-Rt.
Figure 2b - Levels of GSSG (b) in liver homogenates 48h after the last session of the resistance training program in sham-operated sedentary (Sham-Sed), ovariectomized sedentary (Ovx-Sed), sham-operated resistance training, (Sham-Rt) and ovariectomized resistance training (Ovx-Rt). Values are presented as mean ± SDM; p ≤ 0.05. a statistically significant difference compared to Sham-Sed, c compared to Sham-Rt.
Figure 2c - Levels of GSH/GSSG (c) in liver homogenates 48h after the last session of the resistance training program in sham-operated sedentary (Sham-Sed), ovariectomized sedentary (Ovx-Sed), sham-operated resistance training, (Sham-Rt) and ovariectomized resistance training (Ovx-Rt). Values are presented as mean ± SDM; p ≤ 0.05. a statistically significant difference compared to Sham-Sed, c compared to Sham-Rt.
Figure 2d - mRNA expression of glutathione peroxidase (GSH-Px) in the liver 48 h after the last session of the resistance training program in sham-operated sedentary (Sham-Sed), ovariectomized sedentary (Ovx-Sed), sham-operated resistance training, (Sham-Rt) and ovariectomized resistance training (Ovx-Rt). Values are presented as mean ± SDM; p ≤ 0.05. a statistically significant difference compared to Sham-Sed, b compared to Ovx-Sed.

