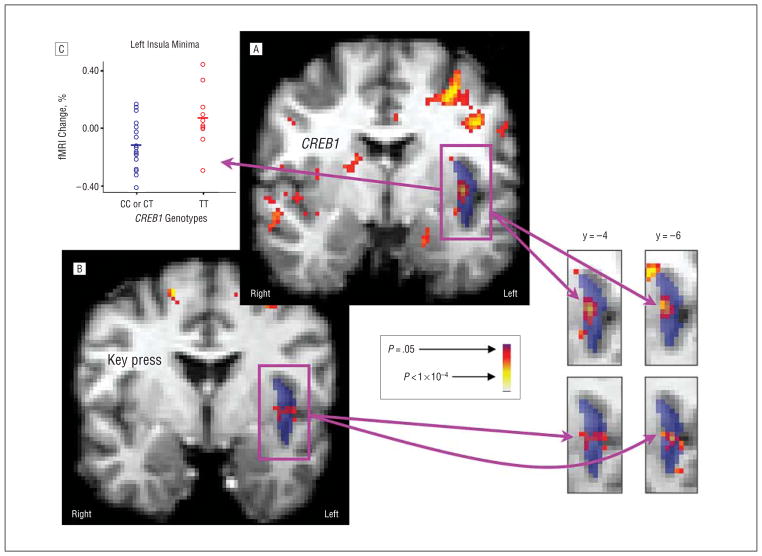
Figure 1.
Results of relative preference–functional magnetic resonance imaging (RP-fMRI) and CREB1-fMRI analyses. A, Contrast by rs4675690 genotype for fMRI data (threshold uncorrected voxelwise P <.01). B, Regression of key-press data to fMRI data (threshold uncorrected voxelwise P <.01). Averaged T1 structural images that have been normalized into the International Consortium for Brain Mapping–152 space are shown in gray tone beneath segmentation templates for the left insula (dark blue), as coronal slices with the anterior-posterior y-coordinate show. Superimposed on these segmentation templates are pseudocolor statistical maps (red and yellow). Explicit overlap in these pseudocolor statistical maps across multiple slices can be observed in the insula snapshots on the lower right, indicating a 3-way association. C, Percentage of signal change in the left insula by rs4675690 genotype.

