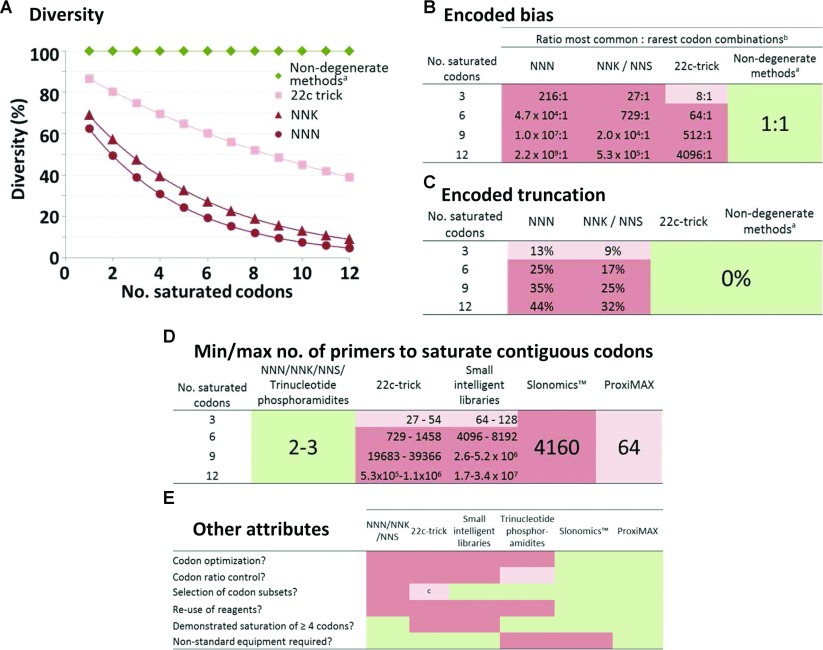
Figure 1. Comparison of performance of common saturation mutagenesis techniques.
Green coloration indicates ideal performance, pale pink coloration indicates tolerable performance, and deep pink coloration indicates unacceptable performance, where non-degenerate methods (a) include ‘small-intelligent libraries’ [8], Slonomics™ [10,11] and ProxiMAX. (A) Diversity was calculated using the formula d=1/(NΣkpk2) [12] and is in agreement for a 12-mer peptide saturated with codon NNN [13]. (B) Ratios represent the theoretical relative concentrations of each individual gene combining any of the most common codons (leucine/arginine/serine, NNN/NNK; or leucine/valine, 22c trick) compared with each individual gene containing any combination of the rarest codons (b) [methionine/tryptophan, NNN; cysteine/aspartate/glutamate/phenylalanine/histidine/isoleucine/lysine/methionine/asparagine/glutamine/tryptophan/tyrosine, NNK; or 18 codons (omitting leucine/valine), 22c trick]. (C) Truncation is calculated as the percentage of sequences that contain one or more termination codons within the saturated region. (D) NNN/NNK/trinucleotide oligonucleotides may be used as a DNA cassette, or as primers in PCR-based mutagenesis; Slonomics™ and ProxiMAX require a fixed number of oligonucleotides and the numbers of primers for the 22c trick [9] and small-intelligent libraries [8] were calculated using the formulae in the respective publications for saturating consecutive codons. (E) cAs dictated by degeneracy limitations.

