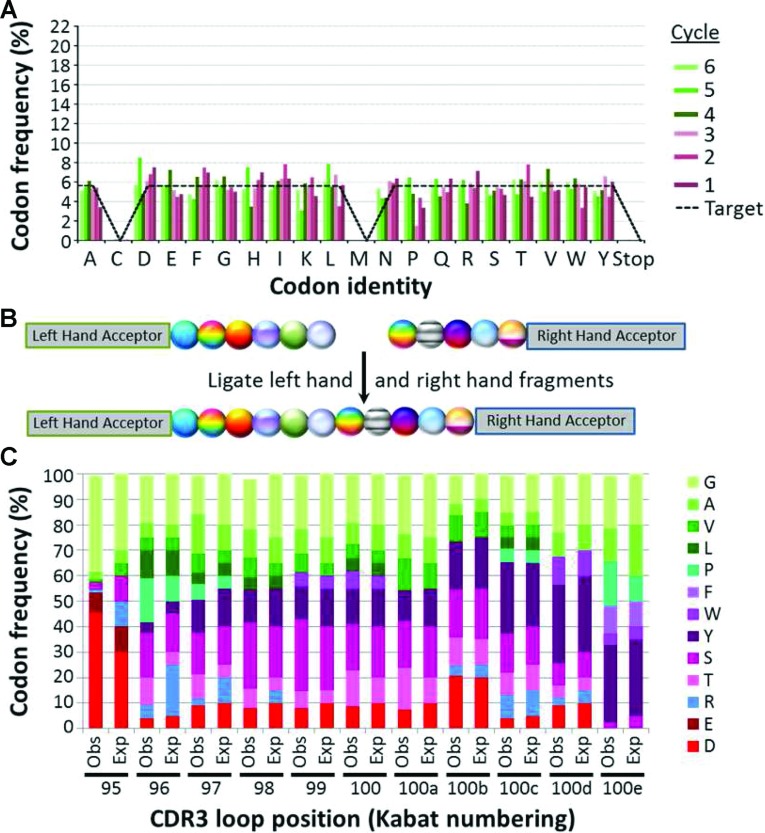
Figure 3. Library construction with controlled codon ratios.
(A) DNA sequence analysis of a library encoded by six cycles of codon addition, optimized to provide unbiased representation. Six cycles of ProxiMAX randomization were undertaken as described in Supplementary Figure S2 (at http://www.biochemsoctrans.org/bst/041/bst0411189add.htm), using right-handed hairpins (Supplementary Table S3 at http://www.biochemsoctrans.org/bst/041/bst0411189add.htm) as donors and an amplicon of pUC19 as the acceptor, with optimized mixtures of 18 codons adjusted to reflect the sequence bias illustrated in Supplementary Figure S2(B). The resulting library was analysed by DNA sequencing, using a MiSeq DNA sequencer according to the manufacturer's instructions. Data represent the analysis of 286684 sequences of the correct length, which represented 79.9% of the entire library. Bars represent the frequency of each codon from each cycle of saturation mutagenesis. The broken line depicts the target representation for each codon. Further analysis of the library can be found in Supplementary Table S2 (at http://www.biochemsoctrans.org/bst/041/bst0411189add.htm). (B) Schematic representation of the procedure for assembling a representative 11-mer CDR3 antibody library. Left-hand (LH, six cycles) and right-hand (RH, five cycles) of codon additions were performed in parallel as described in Supplementary Figure S2(B) with adjusted ratios of codons to compensate for sequence preference as determined in Supplementary Figure S2(B). After the final MlyI digestions, the two assemblies were joined together to generate a region of 11 contiguous saturated codons. (C) DNA sequence analysis of the representative 11-mer CDR3 antibody library. The library was assembled as described in (B) and sequenced using a MiSeq sequencer according to the manufacturer's instructions. Data represent the analysis of 461274 sequences of the correct length, which comprised 74.1% of the entire library. Single codon deletions comprised an additional 7.4% of that library, whereas double and triple codon deletions comprised 2.0% and 1.2% respectively. Expected (designed) frequencies of each codon are compared with observed frequencies for locations 95–100e within the CDR3 loop. Further analysis of the library can be found in Supplementary Table S2.

