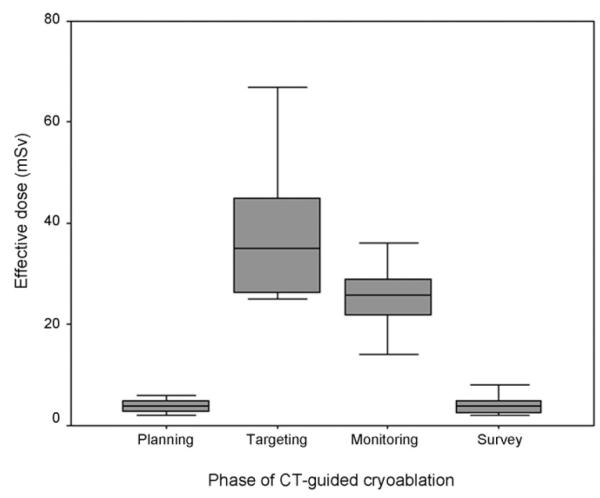
Fig. 2.

Box plot compares effective dose during each phase of CT-guided liver cryoablation procedures. The mean effective dose was highest during targeting followed by monitoring (p < 0.05). However, there was no significant difference between planning and post-ablation survey phases (p > 0.05). Horizontal line within the box indicates median value. The median values are 4 mSv for planning phase, 35 mSv for targeting phase, 26 mSv for monitoring phase, and 4 mSv for post-ablation survey phase.
