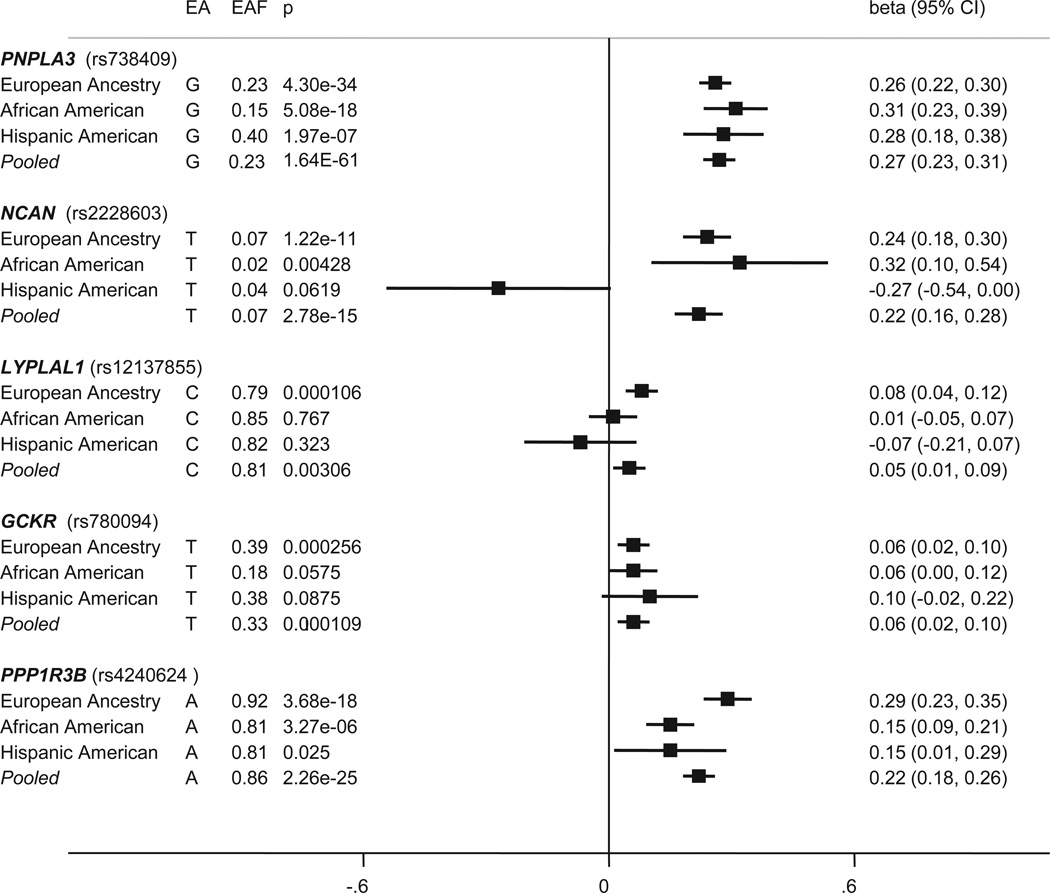
Figure 1. Forest plot of the effect for hepatic steatosis index variants in European-Ancestry, African-American, and Hispanic-American populations.
For each race and a pooled analysis, the effect allele (EA) and frequency (EAF) are listed with the corresponding p-value (p), beta value (beta) and 95% confidence interval (95% CI) for association with hepatic steatosis adjusting for age, age2, gender, alcoholic drinks, and population substructure. Values greater than zero indicate an increase in the amount of hepatic steatosis. The solid vertical line represents no effect (beta=0).

