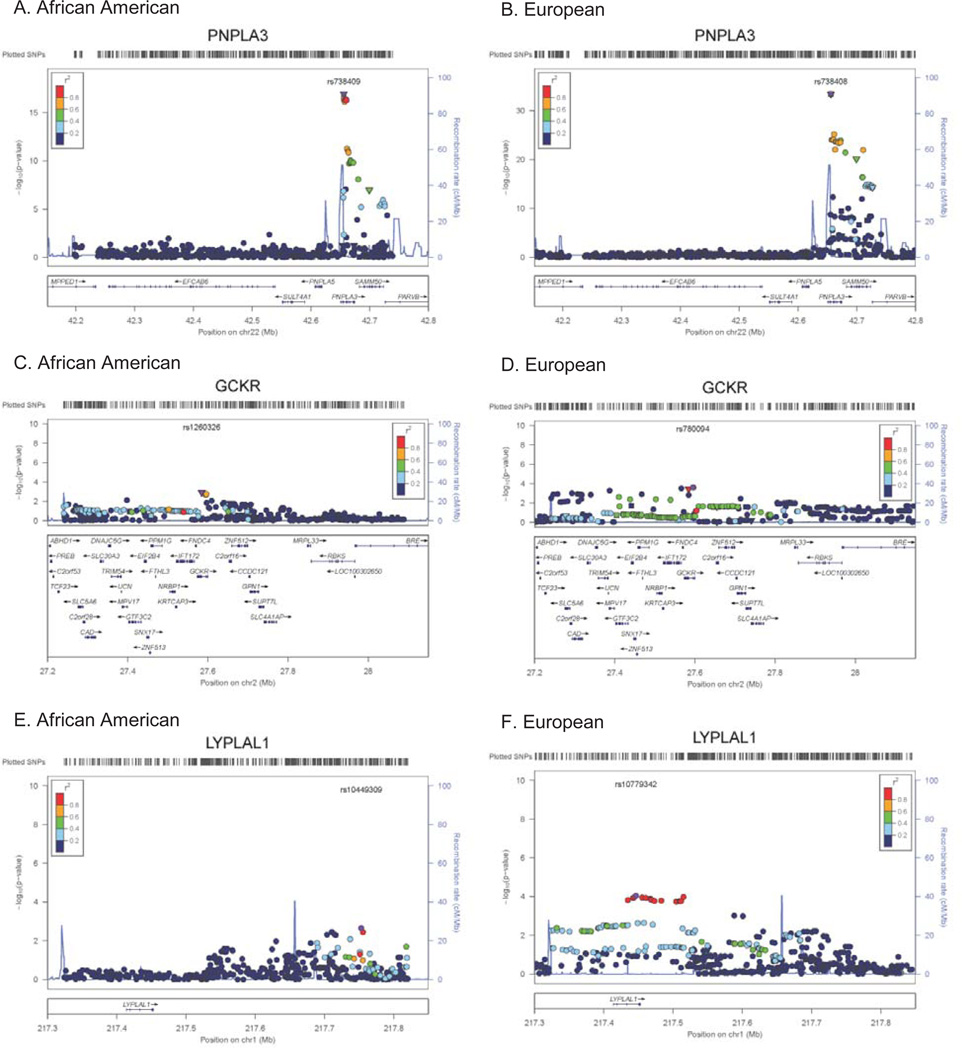
Figure 4. Regional plots of loci robustly assoicated with NAFLD in European-ancestry population and fine-mapped in the African-American population.
A) PNPLA3 in African Americans, B) PNPLA3 in European Americans, C) GCKR in African Americans, D) GCKR in European Americans, E) LYPLAL1 in African Americans, F) LYPLAL1 in European Americans. The variant most robustly associated is denoted in purple annotated by SNP ID with additional genotyped and imputed SNPs passing study-specific quality controls. SNPs are plotted with their meta-analysis p-values as a function of position (hg19). Shape of the data point is indicative of function, i.e. non-synonymous (▼) and no annotation (●), and color indicates LD (r2) with the previously identified variant taken from HapMap (red, r2=0.8–1.0; yellow, r2=0.6–0.8; green, r2=0.4–0.6; cyan, r2=0.2–0.4, and blue, r2<0.2). Estimated recombination rates (HapMap) reflect the local LD structure. Gene annotations were taken from the University of California Santa Cruz genome browser.

