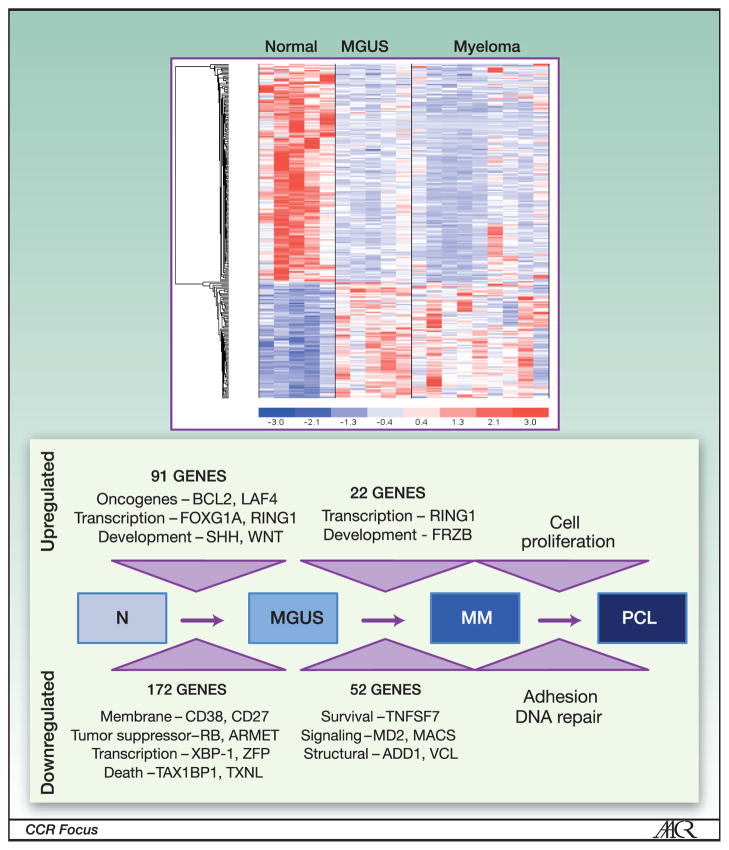
Figure 1. Progression to Myeloma - Gene Expression Analysis.
High-throughput gene expression profile identifies distinct pattern in myeloma and MGUS compared to normal plasma cells (above). Analysis of the expression profile data identifies a multistep model of progression from normalplasma cells to MGUS cells, and to multiple myeloma (MM) PCL- plasma cell leukemia. Figure adapted from Davies et al. Insights into the multistep transformation of MGUS to myeloma using microarray expression analysis. Blood. 2003;102:4504-4511. © the American Society of Hematology.

