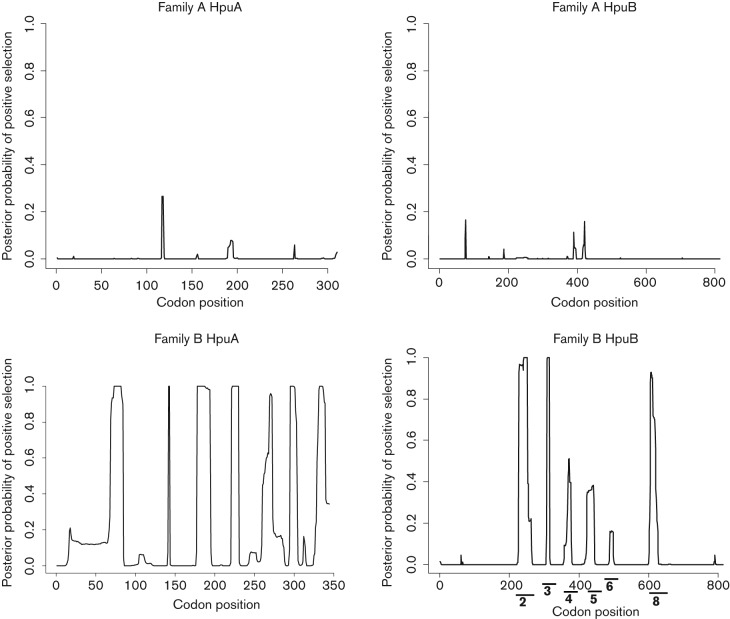
Fig. 3.
Detection of the posterior probability of positive selection acting upon Family A and B HpuAB proteins using the OMEGAMAP algorithm. Codon positions are on the x-axis while the y-axis denotes the posterior probability of positive selection. A value close to 1 is indicative of positive selection. Putative surface-exposed loops belonging to HpuB Family B proteins are denoted by black lines; the numbers indicating the loop number.

