
Fig. 4.
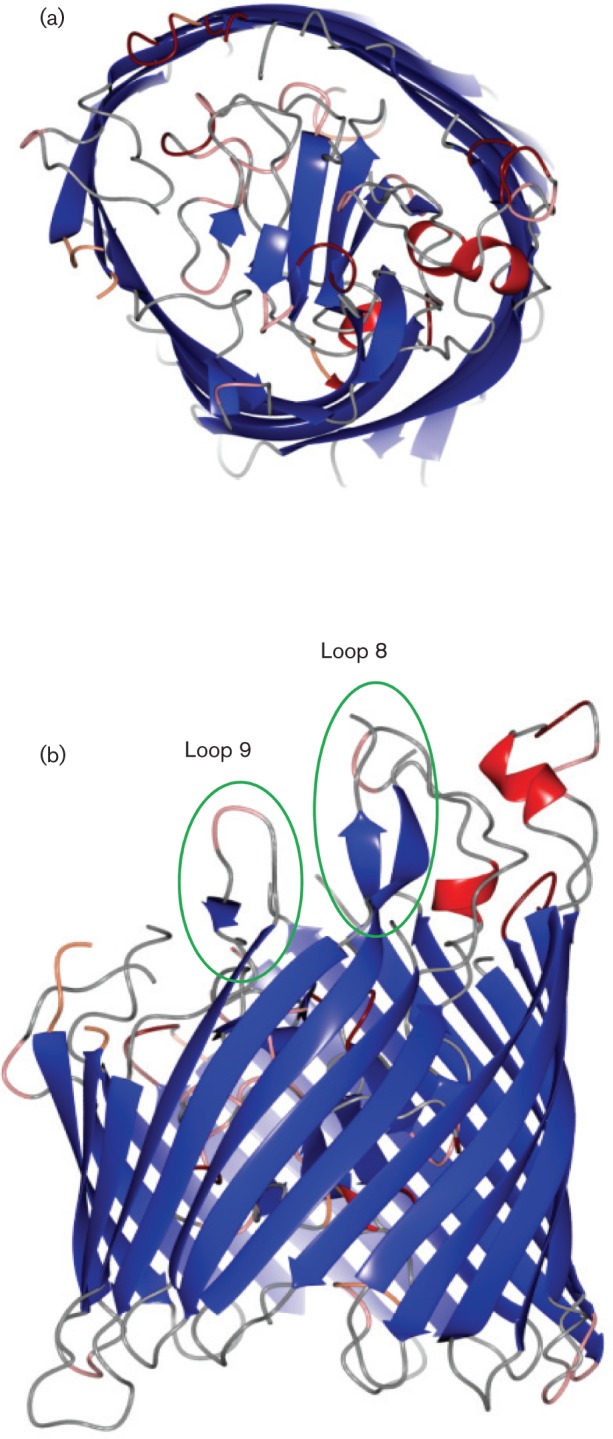
Structural model of HpuB. The structure is presented as a ribbon plot, with α-helices marked in red and β-strands in blue. (a) View from above, showing the location of the plug domain in the lumen of the β-barrel. (b) View from the side; the locations of two of the more variable sequence loops, 8 and 9, are circled and labelled.