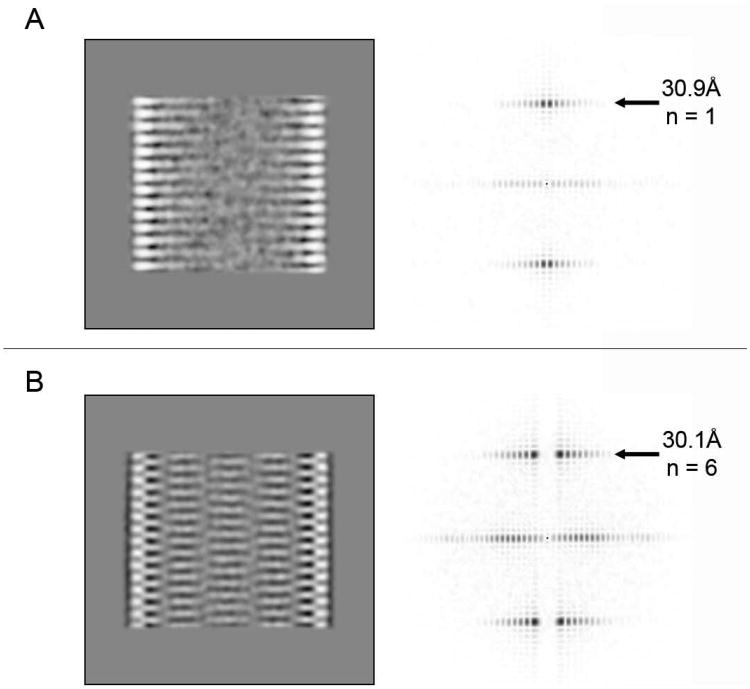
Figure 2. 2D Fourier transform provides evidence for differences in helical packing.
(A) 2D class averages representing the line-pattern and (B) the column pattern, and their corresponding sum of the amplitude spectra of all class members (120 and 242 members in A and B, respectively). The heights of the first layer line and the measured Bessel order (n) are indicated.

