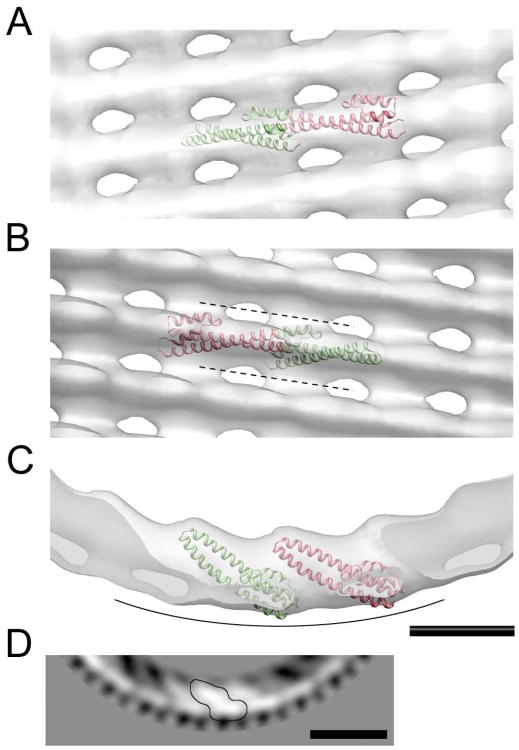
Figure 4. Docking of the CHMP3 structure (helices 1 to 4) into the cryo-EM map. (A – D).
Zoomed views on the docked monomers inside the cryo-EM map. The cryo-EM density is shown as an isosurface in transparent gray color. Adjacent CHMP3 monomers are shown in green and red ribbons. (A) Front view. (B) Same orientation as shown in (A) viewed from the inside; the dotted lines mark the positions of grooves between consecutive strands. (C) Top view, the curved line indicates the membrane-binding surface. (D) Part of a gray-scaled 2D section from the cryo-EM map viewed along the helical axis (corresponding to the orientation in C). One helical asymmetric unit is highlighted (contoured line). Scale bars are respectively 50 Å in panels A to C and 100 Å in panel D.

