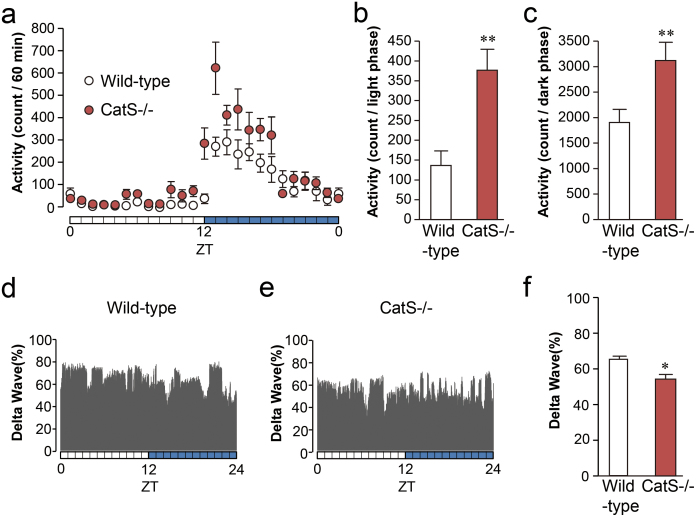
Figure 1. Increase in locomotor activity and reduction of sleep intensity in CatS-/- mice.
(a–c) CatS-/- mice exhibited elevated spontaneous locomotor activity both during the light-phase (b) and the dark-phase (c). The asterisks indicate statistically significant differences from wild-type (**, P < 0.01; unpaired t-test). The data are presented as the mean ± S.E.M. (wild-type N = 8 animals, CatS-/- N = 8 animals). (d, e) the EEG delta power from freely moving wild-type (d) and CatS-/- (e) mice. The graph was plotted in 1 min intervals. (f) The mean relative EEG delta power in the light phase (ZT2-4) in wild-type and CatS-/- mice. The asterisks indicate statistically significant differences between values (*, P < 0.05; unpaired t-test). The data are the means ± S.E.M. (wild-type N = 6 animals, CatS-/- N = 5 animals).

