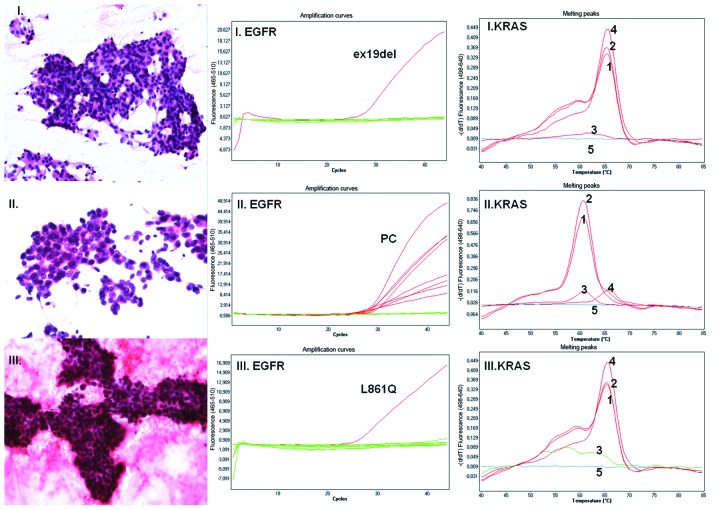
Figure 1.
Lung adenocarcinoma. (I–III) Cytology of lung adenocarcinoma following H&E staining (magnification, ×200, ×400 and ×200 for samples I, II and III, respectively). (I–III EGFR) EGFR status detected using mutation-specific oligonucleotides. Green lines represent baseline value with no mutation detected in exons 18, 19, 20 and 21; red lines represent amplification curves as follows: (I. EGFR) EGFR exon 19 deletion detected in sample I; (II. EGFR) all positive controls in detection of 29 mutations in sample II, no mutation detected in sample II; (III. EGFR) detection of EGFR c.2582T>A (L861Q) in sample III. (I–III KRAS) KRAS status detection. Nos. 1–5 represent melting curves for the CTRL reaction: 1, LOW reaction; 2, HIGH reaction; 3; and for the controls: 4, WT and 5, NTC. Melting curve analysis detected KRAS WT (I. KRAS), KRAS c.35G>A (G12D) (II. KRAS) and KRAS WT (III. KRAS).

