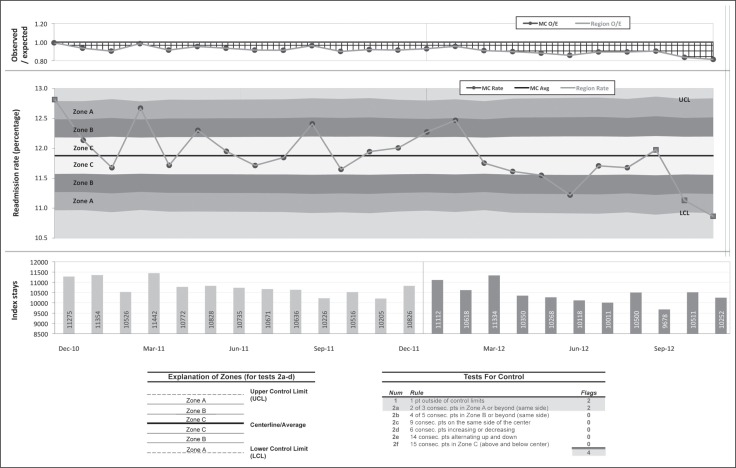
Figure 1.
Kaiser Permanente Southern California Region 30-Day, All-Cause Medicare Risk HEDIS Readmissions (December 2010 to November 2012)
Avg = average; consec = consecutive; HEDIS = Healthcare Effectiveness Data and Information Set; MC = Medical Center (data not shown); O/E = observed/expected ration; pts = patients.

