Figure 2.
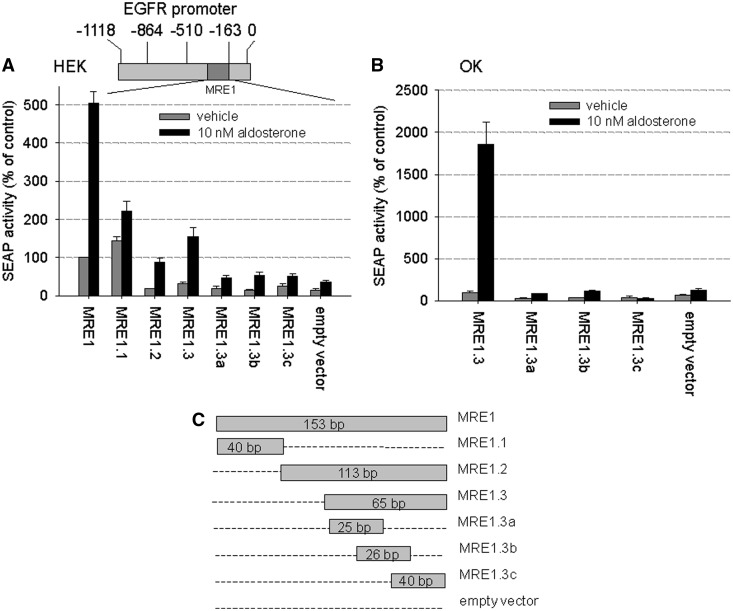
MR interaction site on EGFR promoter (A) HEK cells top: Scheme of the EGFR promoter showing localization of MRE1, bottom: HEK cells transiently transfected with MRE1 reporter plasmid and hMR were incubated with 10 nM aldosterone or vehicle for 48 h, and then reporter gene activities were measured and depicted as percentage of control (MRE1 with vehicle) (N = 3–18, n = 9–45, data represented as mean ± SEM), (B) OK cells transiently transfected with MRE1 reporter plasmid and hMR were incubated with 10 nM aldosterone or vehicle for 48 h, and then reporter gene activities were measured and depicted as percentage of control (MRE1.3 with vehicle) (N = 4–16, n = 15–47, data represented as mean ± SEM), (C) Scheme of the different MRE1 promoter deletion constructs tested in the reporter gene assay.

