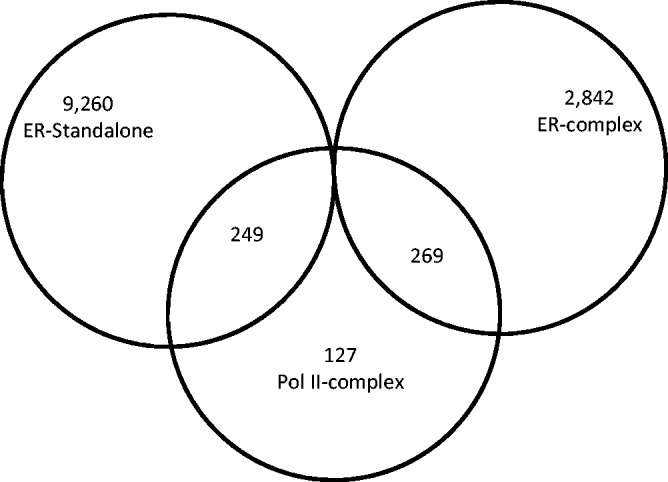
Figure 3.

A Venn diagram illustrating the overlap between the Pol II complexes formed in the absence of ligand and the ERα complexes formed in the presence of ligand.

A Venn diagram illustrating the overlap between the Pol II complexes formed in the absence of ligand and the ERα complexes formed in the presence of ligand.